 CompanyGraph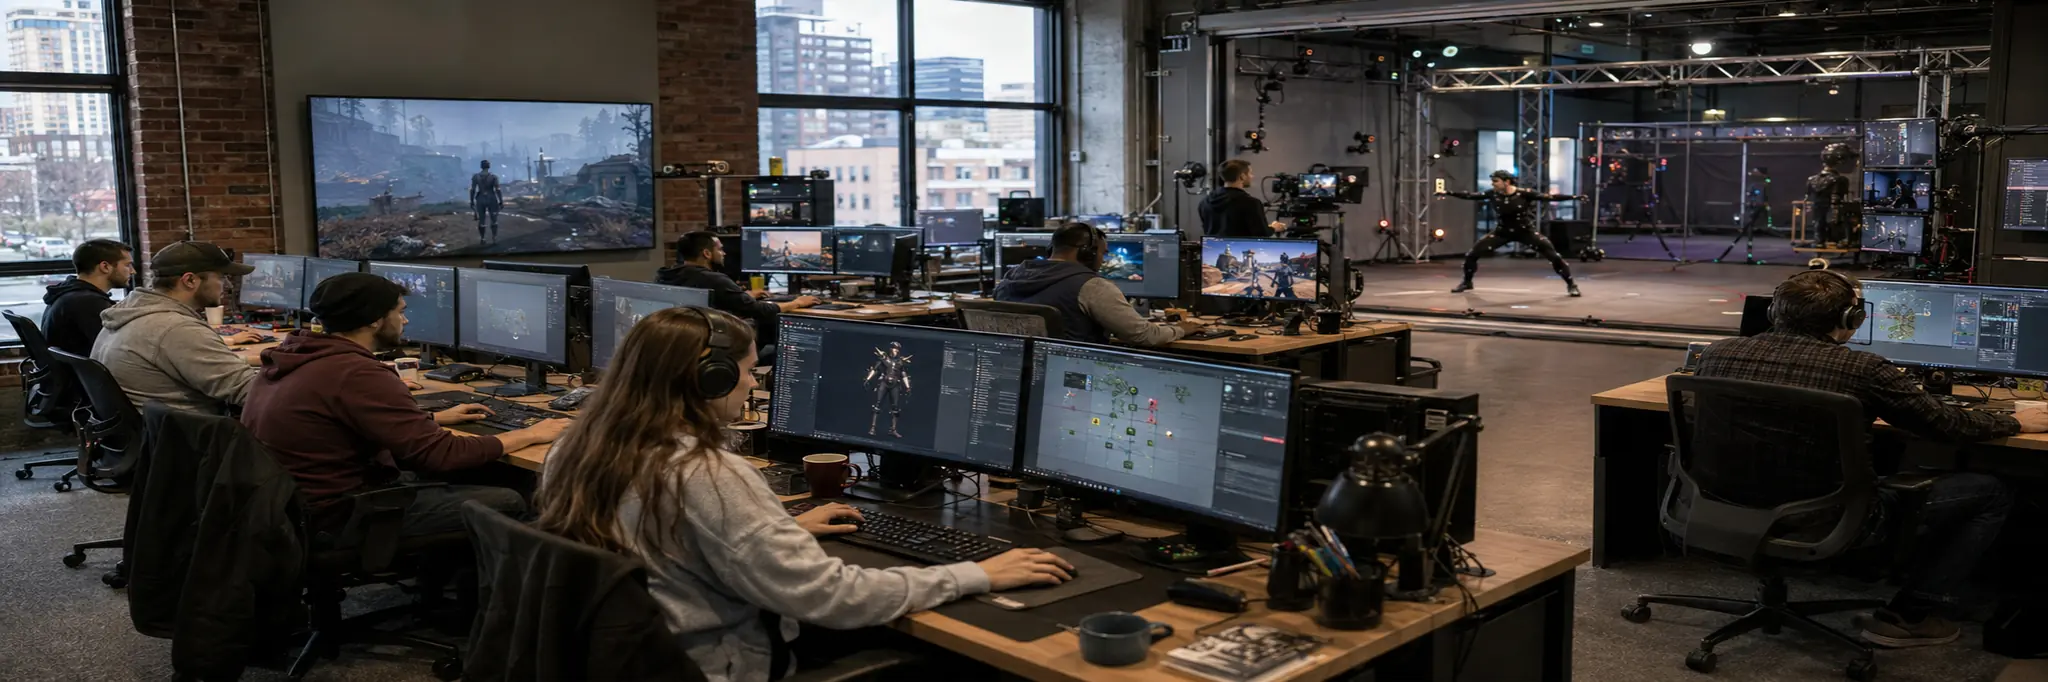
Multi-year development investment with uncertain audience reception concentrates returns in a small fraction of titles, creating hit-driven economics where most projects subsidize the few that succeed.
Electronic gaming and multimedia converts multi-year software development investment into interactive digital entertainment products distributed through console, PC, and mobile platforms. The core activity combines programming, art, design, and narrative production into experiences that respond dynamically to player input, requiring construction of interactive systems—physics engines, AI, rendering pipelines, and network infrastructure—that distinguish games from passive media formats.
The economic structure is defined by high fixed development costs and near-zero marginal distribution costs, creating extreme operating leverage where successful titles generate outsized returns while failures produce total losses. This hit-driven dynamic makes portfolio management and franchise cultivation central concerns. The shift toward live service models transforms the revenue profile from launch spikes into sustained engagement curves, but imposes continuous content production obligations to retain player bases against competing titles.
Distribution is mediated by platform holders who control access to console ecosystems and mobile app stores, extracting percentage-based fees on each transaction. This platform dependency shapes pricing, margin, and go-to-market decisions across all scales of operation. PC distribution through digital storefronts offers somewhat lower fees, while direct-to-consumer channels eliminate intermediary costs but require the publisher to independently solve discovery and payment infrastructure.
Structural Role
Creates interactive software entertainment that captures audience leisure time and engagement, converting multi-year development investment into repeatable digital experiences distributed through platform-mediated storefronts to global consumer audiences.
Scale Differentiation
Large publishers operate multiple studios across genres and platforms, using portfolio diversification to offset the inherent unpredictability of individual title outcomes, and leverage established franchises, global marketing budgets, and direct platform relationships. Mid-size studios build around core franchises or genre expertise, concentrating resources on fewer titles with higher per-project scope. Small independent developers operate with minimal overhead, innovating on game design concepts that larger studios avoid, and rely on digital distribution for audience reach without traditional publishing infrastructure.
Financial Profile
Measured across the 60 companies in this industry with recorded financial statements. Each band spans the middle 90% of companies — 5th to 95th percentile — with the mark at the median. How wide a band runs is itself a reading: a tight band means the industry imposes its economics on every member; a wide one means outcomes differ sharply between its strongest and weakest companies.
Profitability
Gross margin70.1%median
23.9%100.0%
Operating margin8.6%median
0
-35.7%36.2%
Net margin5.8%median
0
-105.1%35.3%
Returns & efficiency
Return on equity4.2%median
0
-79.6%32.5%
Asset turnover0.45×median
0.14×1.08×
Free cash flow / revenue9.3%median
0
-89.0%31.7%
Balance sheet
Current ratio2.60×median
0.65×8.71×
Debt to equity0.07×median
0.00×1.17×
Reinvestment & payout
R&D / revenue14.5%median
1.8%37.1%
Capex / revenue1.9%median
0.1%9.5%
What marks this industry
Where this industry’s typical company sits against the typical company in every other industry we measure — metric by metric.
Gross margin
70.1%typical industry 29.4%
2nd highest of 101 industries with this measure.
Debt to equity
0.07×typical industry 0.37×
3rd lowest of 102 industries with this measure.
R&D / revenue
14.5%typical industry 3.1%
4th highest of 77 industries with this measure.
Current ratio
2.60×typical industry 1.58×
8th highest of 102 industries with this measure.
Scale
53
companies with recorded market value
$1.3B
median company · global median $1.2B
$259M – $33.8B
middle 90% of companies
$313.6B
combined market value
The largest member carries roughly 28% of the combined market value; half the companies sit under $1.3B.
Valuation ranges
Price to book1.96×median
0.60×13.95×
Price to earnings15.92×median
6.60×98.37×
EV / EBITDA bands are not drawn for this industry. Many members run negative values there, and a percentile band across mixed signs has no honest reading — a range is shown only where it means something.
Bands are 5th–95th percentiles across this industry’s companies, computed from reported financial statements. Ratios are currency-free; money values are USD-normalized. These distributions describe how the industry is shaped — they are not a rating of it, and a company’s position inside them is not a forecast. Benchmark set computed 18 September 2026.
Connected Industries
Advertising Agencies
Creates demand for
In-game advertising and marketing campaigns
Consumer Electronics
Creates demand for
Game titles drive console and PC hardware sales
Internet Content & Information
Creates demand for
Streaming, esports, and gaming content platforms
Semiconductors
Creates demand for
Gaming performance requirements drive GPU advancement
Telecom Services
Creates demand for
Online multiplayer and game downloads require bandwidth
Stocks
37 Interactive Entertainment Co., Ltd.
002555
Beijing Ultrapower Software Co., Ltd.
300002
Boyaa Interactive International Limited
0434
Bushiroad Inc.
7803
COFFEE.B
COFFEE.B
Com2uS Corp.
078340
Devsisters Co., Ltd.
194480
DoubleUGames Co., Ltd.
192080
Electronic Arts Inc.
EA
Everplay Group plc
EVPL
Frontier Developments plc
FDEV
Gaming Realms plc
GMR
G-bits Network Technology Co., Ltd.
603444
Giant Network Group Co., Ltd.
002558
Guangxi Xinxunda Technology Co., Ltd.
300518
Guangzhou Wahlap Technology Co., Ltd.
301011
GungHo Online Entertainment, Inc.
3765
Hangzhou Electronic Soul Co., Ltd.
603258
Hangzhou Shunwang Technology Co., Ltd.
300113
IGG Inc
0799
Kaiser China Cultural Co., Ltd.
002425
Kakao Games Corp.
293490
Kingnet Network Co., Ltd.
002517
Kingsoft Corporation Limited
3888
Krafton Inc.
259960
Kunlun Tech Co., Ltd.
300418
Marvelous Inc.
7844
Modern Times Group MTG AB
MTG.B
Nat Games Co.,Ltd.
225570
Nazara Technologies Ltd.
NAZARA
Ncsoft Corp.
036570
NetDragon Websoft Holdings Limited
0777
NetEase Inc.
9999
Netmarble Corp.
251270
NHN Corporation
181710
Ourpalm Co. Ltd.
300315
Pearl Abyss Corp.
263750
Playtika Holding Corp
PLTK
Roblox Corporation
RBLX
Shenzhen Bingchuan Network Co., Ltd.
300533
Shenzhen ZQGame Co., Ltd.
300052
Shift Up Corp.
462870
Sichuan Xun You Network Technology Co., Ltd.
300467
Soft-World International Corporation
5478
Stillfront Group AB (publ)
SF
Take-Two Interactive Software, Inc.
TTWO
Team17 Group PLC
TM17
Tianyu Digital Technology Inc.
002354
TinyBuild Inc.
TBLD
Ubisoft Entertainment SA
UBI
Vivendi SE
VIV
XD Inc.
2400
Youzu Interactive Co., Ltd.
002174
Zengame Technology Holding Limited
2660
Zhejiang Century Huatong Group Co., Ltd.
002602
Zhejiang Jinke Tom Culture Co., Ltd.
300459