 CompanyGraph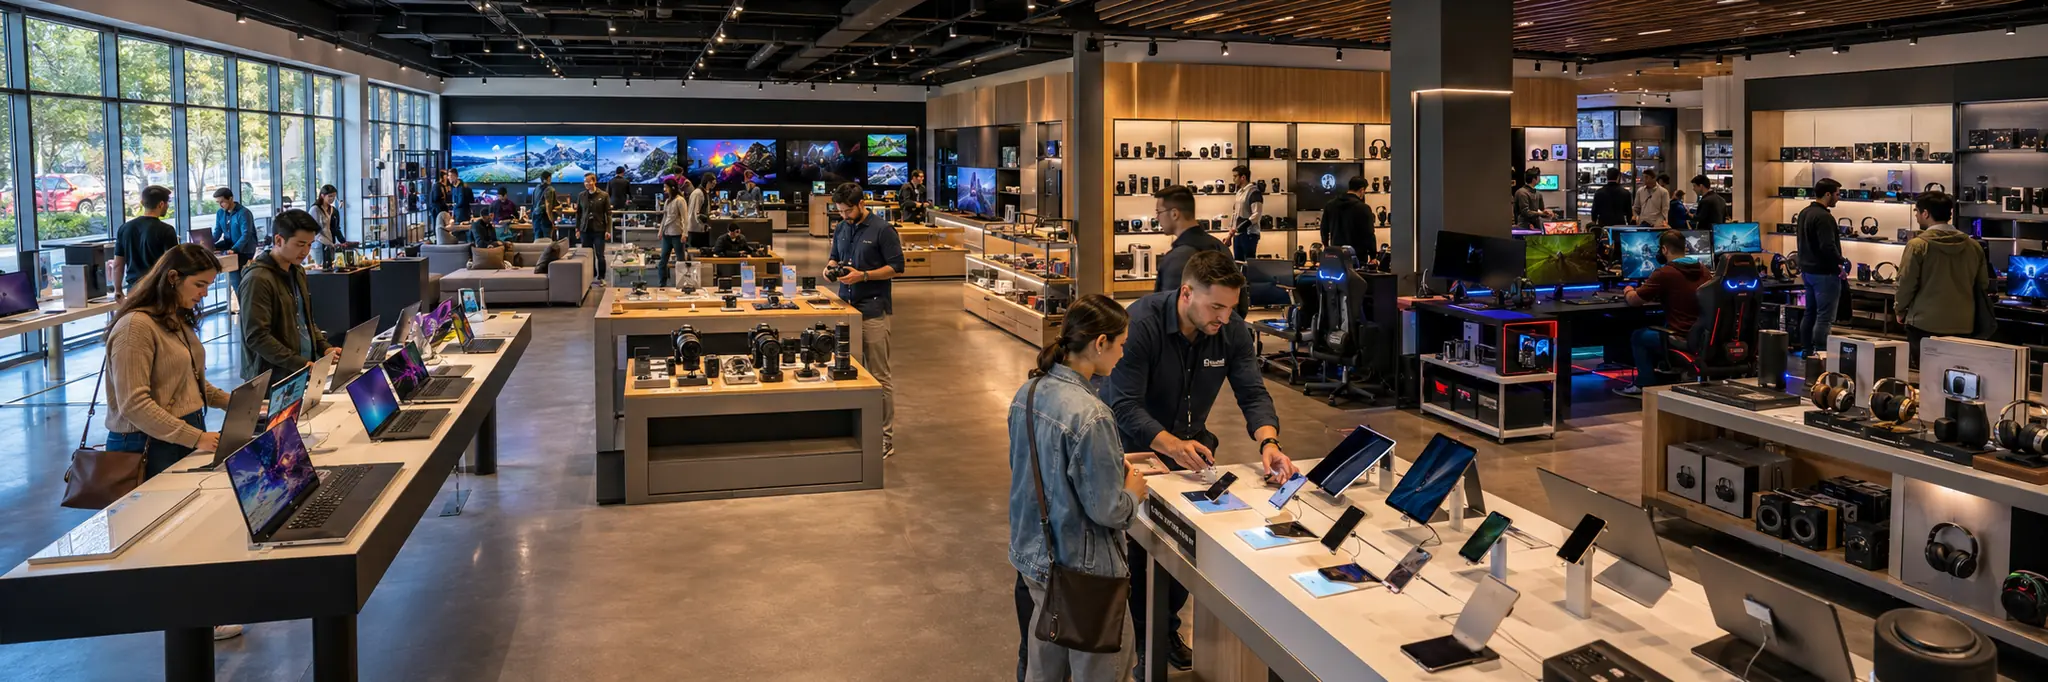
Compressed 12-to-24-month product cycles require continuous hardware iteration, while concentrated semiconductor and display supply chains constrain the conversion of industrial design into differentiated devices.
Consumer electronics companies convert standardized components — processors, displays, memory, sensors, and batteries — into differentiated devices through industrial design, system integration, and software ecosystem development. The structural role is conversion: transforming commodity inputs into branded products where value is captured through design coherence, platform lock-in, and ecosystem services layered on top of hardware. Companies controlling both hardware and software capture higher margins and stronger user retention than those competing primarily on hardware specifications.
Product cycles of 12-24 months drive continuous development spending, with component costs heavily influencing unit economics. Manufacturing is concentrated among a small number of contract assemblers, creating shared supply chain dependencies across competitors. Device categories vary in maturity: smartphones and laptops are replacement-cycle driven in developed markets, while wearables, smart home devices, and spatial computing represent expanding categories where dominant designs are still forming.
Supply chain resilience has become a structural priority as concentration of assembly in specific regions creates exposure to trade policy, logistics disruption, and geopolitical tension. Companies are distributing manufacturing across multiple countries, though scale economics and supplier proximity constrain diversification. Across all categories, services revenue layered on hardware sales has become a significant margin contributor for ecosystem-oriented companies, shifting the competitive emphasis from unit economics toward platform engagement and recurring revenue.
Structural Role
Coordinates the conversion of standardized semiconductor components into differentiated consumer devices through industrial design, system integration, and ecosystem development, bridging upstream component manufacturing and downstream consumer markets where product cycles, brand identity, and platform lock-in determine competitive positioning.
Scale Differentiation
Large companies leverage component purchasing volume, amortize R&D across global unit shipments, and build ecosystem network effects that raise switching costs and sustain margin premiums. Mid-size companies specialize in specific device categories or regional markets where focused positioning offsets scale disadvantages. Smaller firms compete on niche form factors, open ecosystems, or premium positioning in categories where volume economics are less dominant.
Financial Profile
Measured across the 58 companies in this industry with recorded financial statements. Each band spans the middle 90% of companies — 5th to 95th percentile — with the mark at the median. How wide a band runs is itself a reading: a tight band means the industry imposes its economics on every member; a wide one means outcomes differ sharply between its strongest and weakest companies.
Profitability
Gross margin19.2%median
7.9%47.5%
Operating margin4.6%median
0
-11.0%17.8%
Net margin3.9%median
0
-40.6%14.9%
Returns & efficiency
Return on equity8.9%median
0
-15.4%24.7%
Asset turnover0.87×median
0.29×1.78×
Free cash flow / revenue-2.1%median
0
-99.4%13.9%
Balance sheet
Current ratio1.47×median
0.62×4.31×
Debt to equity0.29×median
0.01×1.89×
Reinvestment & payout
R&D / revenue5.5%median
2.6%13.0%
Capex / revenue2.9%median
0.4%18.4%
What marks this industry
Where this industry’s typical company sits against the typical company in every other industry we measure — metric by metric.
Operating margin
4.6%typical industry 8.1%
15th lowest of 101 industries with this measure.
Gross margin
19.2%typical industry 29.4%
18th lowest of 101 industries with this measure.
Asset turnover
0.87×typical industry 0.59×
20th highest of 101 industries with this measure.
R&D / revenue
5.5%typical industry 3.1%
16th highest of 77 industries with this measure.
Scale
52
companies with recorded market value
$1.1B
median company · global median $1.2B
$273M – $91.1B
middle 90% of companies
$6.1T
combined market value
The largest member carries roughly 74% of the combined market value; half the companies sit under $1.1B.
Valuation ranges
Price to book2.75×median
0.62×16.92×
Price to earnings24.88×median
12.23×116.76×
EV / EBITDA bands are not drawn for this industry. Many members run negative values there, and a percentile band across mixed signs has no honest reading — a range is shown only where it means something.
Bands are 5th–95th percentiles across this industry’s companies, computed from reported financial statements. Ratios are currency-free; money values are USD-normalized. These distributions describe how the industry is shaped — they are not a rating of it, and a company’s position inside them is not a forecast. Benchmark set computed 18 September 2026.
Stocks
Anker Innovations Technology Co., Ltd.
300866
Apple Inc.
AAPL
Appotronics Corp., Ltd.
688007
Aucma Co., Ltd.
600336
Coretronic Corporation
5371
DBG Technology Co., Ltd.
300735
Dixon Technologies (India) Ltd.
DIXON
Dongguan Yutong Optical Technology Co., Ltd.
300790
Eastech Holding Ltd.
5225
Edifier Technology Co. Ltd.
002351
Emdoor Information Co. Ltd.
001314
Foster Electric Co., Ltd.
6794
Goertek Inc.
002241
Guangdong AVCiT Technology Co., Ltd.
001229
Guangdong Chant Group Inc.
002616
Guangdong Goworld Co., Ltd.
000823
Guodian Nanjing Automation Co., Ltd.
600268
Guoguang Electric Co., Ltd.
002045
Hangzhou Ezviz Network Co. Ltd.
688475
Hansong (Nanjing) Technology Ltd.
301491
Hisense Visual Technology Co. Ltd.
600060
Hivi Acoustics Technology Co., Ltd.
002888
Home Control International Limited
1747
Huaqin Technology Co., Ltd.
603296
Jinhua Chunguang Technology Co., Ltd.
603657
Konka Group Co., Ltd.
200016
Konka Group Co., Ltd.
000016
LG Corp
003550
LG Display Co., Ltd.
034220
LG Electronics Inc.
066570
LG Electronics India Limited
LGEINDIA
Maxell Ltd.
6810
Merry Electronics Co., Ltd.
2439
Minami Acoustics Ltd.
301383
Primax Electronics Ltd.
4915
Samsung Electronics Co., Ltd.
005930
Shanghai Longcheer Technology Co., Ltd.
603341
Sharetronic Data Technology Co., Ltd.
300857
Shenzhen Absen Optoelectronic Co., Ltd.
300389
Shenzhen Aoni Electronic Co., Ltd.
301189
Shenzhen Breo Technology Co., Ltd.
688793
Shenzhen Crastal Technology Co., Ltd.
300824
Shenzhen Fenda Technology Co., Ltd.
002681
Shenzhen Liantronics Co., Ltd.
300269
Shenzhen Transsion Holdings Co. Ltd.
688036
Skyworth Group Limited
0751
Sonos Inc.
SONO
Sony Group Corp.
6758
Soyea Technology Co., Ltd.
000909
Sun Corporation
6736
TCL Electronics Holdings Ltd.
1070
Tellhow Sci-Tech Co., Ltd.
600590
Turtle Beach Corporation
TBCH
Ugreen Group Ltd.
301606
Vuzix Corporation
VUZI
Xgimi Technology Co., Ltd.
688696
Xiamen Intretech Inc.
002925