 CompanyGraph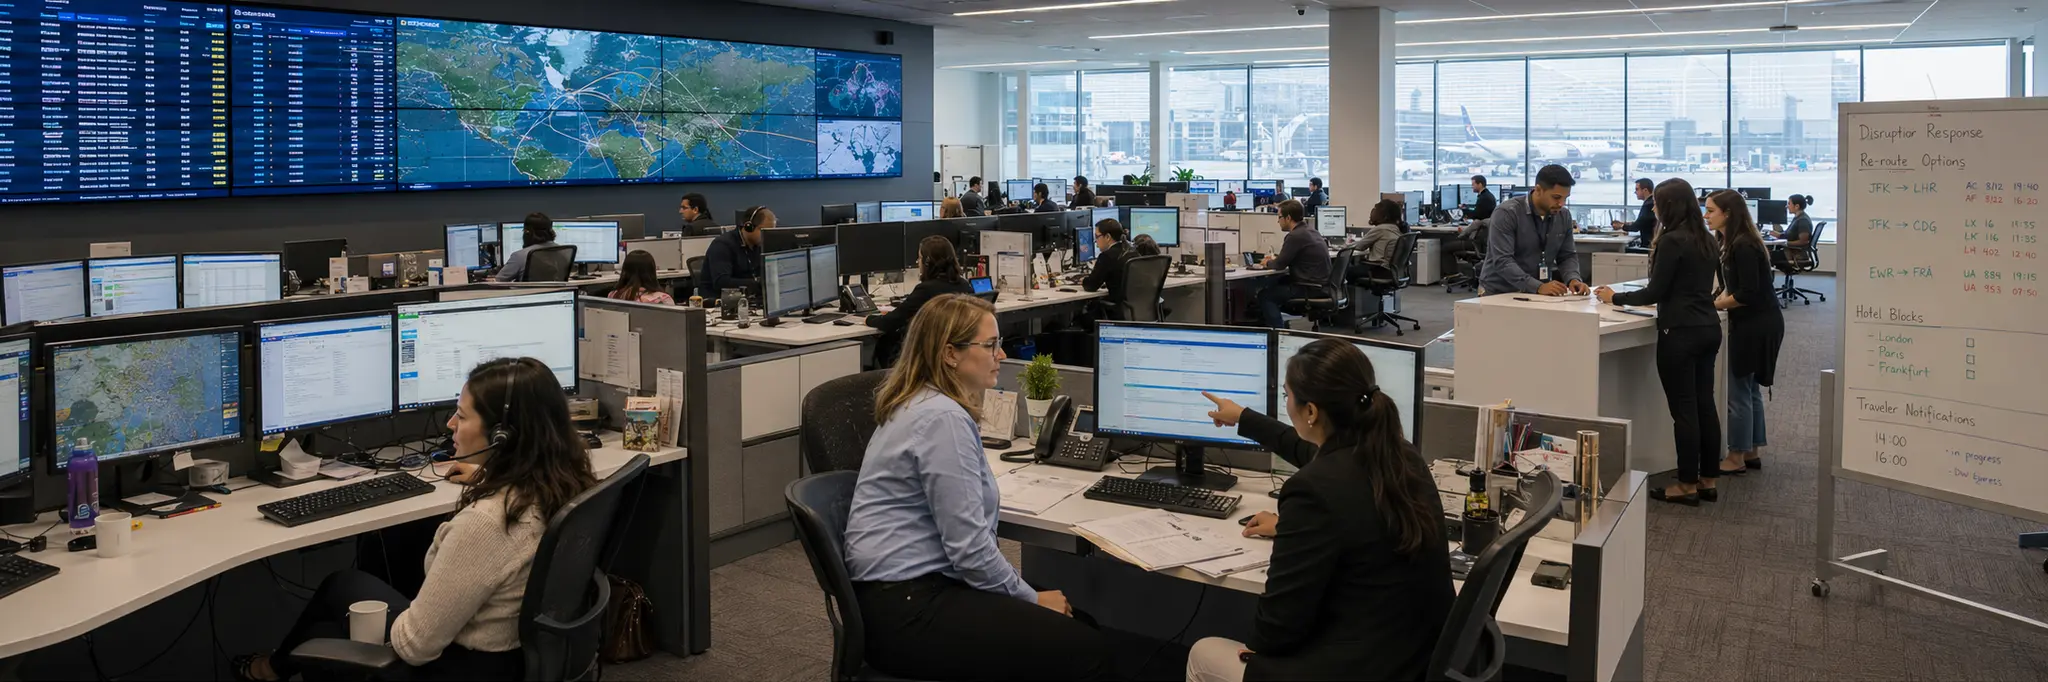
Intermediary position between supplier pricing power and consumer price sensitivity compresses margins, while perishable travel inventory that expires without residual value creates urgency in matching supply to demand.
The travel services industry transforms fragmented, perishable travel supply into structured, bookable offerings for consumers and businesses. Airlines, hotels, ground transport operators, and experience providers each manage their own inventory, pricing, and availability. Travel service firms reduce the search and assembly costs that travelers would otherwise face when combining these elements into coherent itineraries, capturing a transaction-based margin on each booking.
The industry's intermediary position creates a distinctive margin dynamic. Inventory is perishable and controlled by third parties, meaning the intermediary absorbs coordination complexity without owning the underlying assets. Platform economics reward scale in supplier relationships and consumer reach, while geographic expansion multiplies regulatory and compliance obligations across visa regimes, health requirements, and tourism taxation that vary by corridor. Technology platforms have shifted coordination from local availability knowledge to data-driven search, comparison, and personalization.
Revenue depends on transaction volume across booking channels, making the industry structurally exposed to shifts in consumer discretionary spending, supplier disintermediation efforts, and disruptions to cross-border movement. The compliance surface area scales with geographic reach, as each new market introduces distinct regulatory requirements governing travel operations, consumer protection, and data privacy.
Structural Role
Coordinates the matching of distributed, perishable travel supply with distributed consumer demand, reducing search and assembly costs for travelers while channeling volume toward providers across transportation, lodging, and experience segments.
Scale Differentiation
Large operators function as high-volume transaction platforms with substantial supplier negotiating power, proprietary technology infrastructure, and cross-selling across lodging, transport, and experiences. Mid-sized operators focus on regional markets or specific travel categories, building moderate technology platforms while maintaining service differentiation. Small firms specialize in niche segments or personalized concierge models where relationship depth compensates for limited supplier leverage.
Financial Profile
Measured across the 38 companies in this industry with recorded financial statements. Each band spans the middle 90% of companies — 5th to 95th percentile — with the mark at the median. How wide a band runs is itself a reading: a tight band means the industry imposes its economics on every member; a wide one means outcomes differ sharply between its strongest and weakest companies.
Profitability
Gross margin48.4%median
12.4%93.7%
Operating margin14.7%median
0
-6.5%31.8%
Net margin8.6%median
0
-4.3%25.4%
Returns & efficiency
Return on equity8.5%median
0
-0.9%45.1%
Asset turnover0.48×median
0.22×1.45×
Free cash flow / revenue5.7%median
0
-16.0%23.1%
Balance sheet
Current ratio1.31×median
0.25×3.06×
Debt to equity0.21×median
0.01×3.30×
Reinvestment & payout
Capex / revenue4.9%median
0.4%27.6%
What marks this industry
Where this industry’s typical company sits against the typical company in every other industry we measure — metric by metric.
Current ratio
1.31×typical industry 1.58×
16th lowest of 102 industries with this measure.
Operating margin
14.7%typical industry 8.1%
17th highest of 101 industries with this measure.
Debt to equity
0.21×typical industry 0.37×
18th lowest of 102 industries with this measure.
Free cash flow / revenue
5.7%typical industry 1.5%
18th highest of 101 industries with this measure.
Scale
37
companies with recorded market value
$1.1B
median company · global median $1.2B
$294M – $83.8B
middle 90% of companies
$550.1B
combined market value
The largest member carries roughly 26% of the combined market value; half the companies sit under $1.1B.
Valuation ranges
Price to book2.64×median
0.78×18.08×
Price to earnings21.00×median
8.01×128.74×
EV / EBITDA13.46×median
1.27×42.15×
Bands are 5th–95th percentiles across this industry’s companies, computed from reported financial statements. Ratios are currency-free; money values are USD-normalized. These distributions describe how the industry is shaped — they are not a rating of it, and a company’s position inside them is not a forecast. Benchmark set computed 18 September 2026.
Connected Industries
Advertising Agencies
Creates demand for
Customer acquisition through advertising
Airlines
Distributes for
Aggregates and distributes airline inventory
Leisure
Distributes for
Tours and experience booking
Lodging
Distributes for
Hotel booking and room distribution
Resorts & Casinos
Distributes for
Software Infrastructure
Provides infrastructure for
Booking platforms run on cloud infrastructure
Stocks
Airbnb, Inc.
ABNB
Anhui Jiuhuashan Tourism Development Co., Ltd.
603199
Booking Holdings Inc.
BKNG
Caissa Tosun Development Co., Ltd.
000796
Carnival Corporation
CCL
Changbai Mountain Tourism Co., Ltd.
603099
EaseMyTrip Planners Ltd.
EASEMYTRIP
eDreams ODIGEO S.A.
EDR
Emei Shan Tourism Co., Ltd.
000888
Expedia Group, Inc.
EXPE
Global Business Travel Group, Inc.
GBTG
Guangzhou Lingnan Group Co., Ltd.
000524
Hana Tour Service Inc.
039130
Indian Railway Catering and Tourism Corporation Ltd.
IRCTC
Jet2 plc
JET2
KNT-CT Holdings Co., Ltd.
9726
Le Travenues Technology Ltd.
IXIGO
Lindblad Expeditions Holdings Inc.
LIND
Lion Travel Service Co., Ltd.
2731
MakeMyTrip Limited
MMYT
Miramar Hotel and Investment Company, Limited
0071
Net Holding A.S.
NTHOL
Norwegian Cruise Line Holdings Ltd.
NCLH
On the Beach Group plc
OTB
Pursuit Attractions and Hospitality
PRSU
Royal Caribbean Group
RCL
Tboteck Ltd.
TBOTEK
Ten Lifestyle Group plc
TENG
Thomas Cook (India) Ltd.
THOMASCOOK
Tongcheng-Elong Holdings Limited
0780
Travel + Leisure Co.
TNL
Tripadvisor Inc.
TRIP
Trip.com Group Ltd.
9961
Utour Group Co., Ltd.
002707
Viking Holdings Ltd
VIK
Western Regions Tourism Development Co., Ltd.
300859
Wuhan Sante Cableways Group Co., Ltd.
002159
Xi'an Qujiang Cultural Tourism Co., Ltd.
600706
Zhejiang Sunriver Culture Co., Ltd.
600576