 CompanyGraph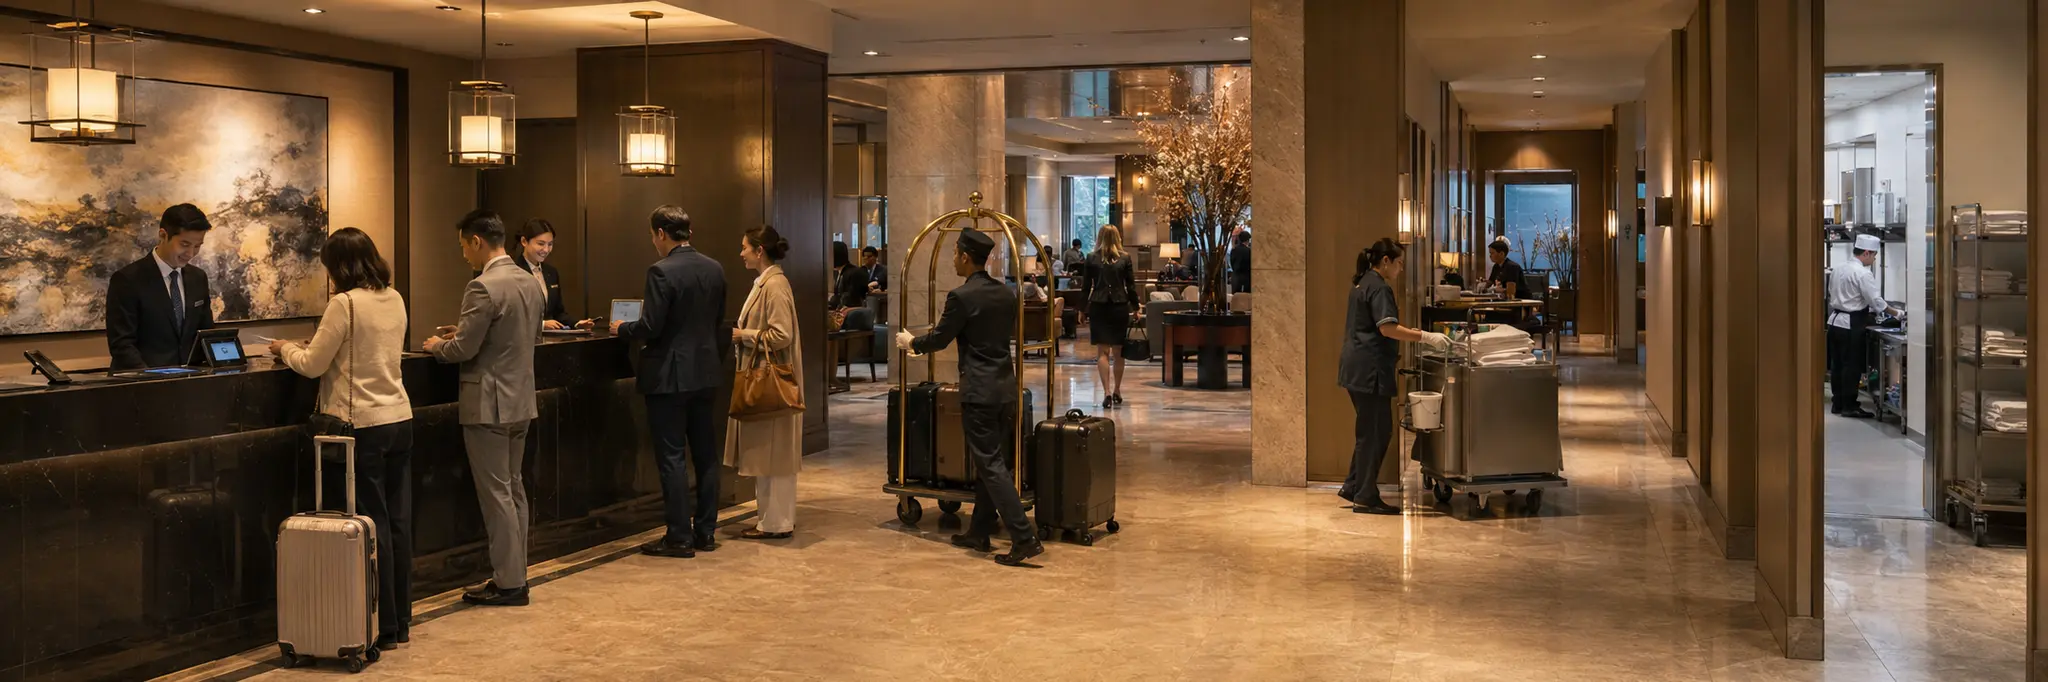
Perishable room inventory where each unoccupied night represents permanently lost revenue combines with high fixed-cost structures to make profitability acutely sensitive to occupancy rate fluctuations.
The lodging industry operates on the fundamental constraint that hotel rooms are perishable inventory: an unoccupied room on any given night represents permanently lost revenue. This perishability drives the yield management apparatus where pricing algorithms continuously adjust rates based on booking pace, local events, competitive positioning, and demand patterns. Supply is fixed in the short term while demand fluctuates daily, weekly, and seasonally, creating a persistent optimization problem that rewards sophisticated revenue management but can never fully eliminate the mismatch between capacity and demand.
The evolution toward asset-light business models has restructured the industry's economics. Major hotel companies have separated brand ownership and management from property ownership, collecting franchise fees and management contracts while third-party investors bear capital costs and real estate risk. Franchisors earn stable, recurring fee income with limited capital intensity, while property owners face the full cyclicality of occupancy rates, renovation requirements, and local market dynamics. Location economics create stratification that persists across cycles, as properties in high-barrier markets with constrained new supply maintain pricing power while those in low-barrier markets face recurring supply additions that cap rate growth.
The labor structure creates a cost floor that limits margin expansion. Hotels require housekeeping, front desk, maintenance, and food service staff whose work cannot be fully automated given the physical and interpersonal nature of hospitality. Wage pressure flows directly to operating costs, and unlike manufacturing, there is limited ability to substitute capital for labor without degrading the service experience that justifies room rates. This labor intensity, combined with ongoing capital expenditure for property standards and brand compliance, constrains the margin band even for well-occupied properties.
Structural Role
Provides temporary shelter and accommodation for people away from their primary residence, converting fixed physical room capacity into time-segmented occupancy revenue and solving the coordination problem of matching geographically fixed lodging supply with the transient demand patterns of business and leisure travel.
Scale Differentiation
Large lodging companies leverage brand portfolios spanning multiple price tiers and global reservation systems that aggregate demand across thousands of properties, operating primarily through asset-light franchise models where the parent company collects fees while property owners bear real estate risk. Mid-size operators manage regional portfolios or single-tier brands where local market knowledge and operational focus provide competitive advantages. Smaller operators own and manage individual properties, retaining direct control over guest experience but absorbing the full capital intensity and cyclical exposure of property ownership.
Financial Profile
Measured across the 52 companies in this industry with recorded financial statements. Each band spans the middle 90% of companies — 5th to 95th percentile — with the mark at the median. How wide a band runs is itself a reading: a tight band means the industry imposes its economics on every member; a wide one means outcomes differ sharply between its strongest and weakest companies.
Profitability
Gross margin42.2%median
10.5%75.0%
Operating margin16.3%median
0
-6.4%37.1%
Net margin11.7%median
0
-46.1%46.2%
Returns & efficiency
Return on equity6.2%median
0
-33.1%30.9%
Asset turnover0.30×median
0.07×0.96×
Free cash flow / revenue9.6%median
0
-24.1%53.1%
Balance sheet
Current ratio1.03×median
0.40×5.45×
Debt to equity0.71×median
0.03×3.24×
Reinvestment & payout
Capex / revenue8.5%median
0.4%26.8%
What marks this industry
Where this industry’s typical company sits against the typical company in every other industry we measure — metric by metric.
Current ratio
1.03×typical industry 1.58×
6th lowest of 102 industries with this measure.
Free cash flow / revenue
9.6%typical industry 1.5%
9th highest of 101 industries with this measure.
Asset turnover
0.30×typical industry 0.59×
12th lowest of 101 industries with this measure.
Capex / revenue
8.5%typical industry 3.8%
14th highest of 101 industries with this measure.
Scale
49
companies with recorded market value
$877M
median company · global median $1.2B
$273M – $21.1B
middle 90% of companies
$308.0B
combined market value
The largest member carries roughly 30% of the combined market value; half the companies sit under $877M.
Valuation ranges
Price to book2.42×median
0.49×12.63×
Price to earnings27.84×median
10.72×229.00×
EV / EBITDA bands are not drawn for this industry. Many members run negative values there, and a percentile band across mixed signs has no honest reading — a range is shown only where it means something.
Bands are 5th–95th percentiles across this industry’s companies, computed from reported financial statements. Ratios are currency-free; money values are USD-normalized. These distributions describe how the industry is shaped — they are not a rating of it, and a company’s position inside them is not a forecast. Benchmark set computed 18 September 2026.
Connected Industries
Airlines
Creates demand for
Air travel generates lodging demand
Furnishings, Fixtures & Appliances
Creates demand for
Room furnishing and renovation cycles
Real Estate Development
Supplies inputs to
Property development provides hotel real estate
Restaurants
Creates demand for
Hotel food and beverage operations
Staffing & Employment Services
Creates demand for
Seasonal hospitality labor
Travel Services
Creates demand for
Hotels listed on OTAs and travel platforms
Stocks
Accor SA
AC
Ambassador Hotel Co., Ltd.
2704
Apeejay Surrendra Park Hotels Ltd.
PARKHOTELS
BTG Hotels Group Co., Ltd.
600258
Bukit Uluwatu Villa Tbk.
BUVA
China Cyts Tours Holding Co. Ltd.
600138
Choice Hotels International Inc.
CHH
Citra Putra Realty Tbk
CLAY
Civeo Corporation
CVEO
Dusit Thani Public Company Limited
DUSIT
EIH Limited
EIHOTEL
Formosa International Hotels Corporation
2707
Fujita Kanko Inc.
9722
Guilin Tourism Co., Ltd.
000978
Hanjin KAL Corp.
180640
Hilton Worldwide Holdings Inc.
HLT
Hotel Grand Central Ltd
H18
Huangshan Tourism Development Co. Ltd.
900942
Huangshan Tourism Development Co. Ltd.
600054
Huatian Hotel Group Co. Ltd.
000428
H World Group Limited
1179
Hyatt Hotels Corporation
H
Imperial Hotel Ltd.
9708
Indian Hotels Company Ltd.
INDHOTEL
InterContinental Hotels Group PLC
IHG
Israel Canada Hotels Ltd
ICHO
Isrotel Ltd.
ISRO
Jabal Omar Development Co.
4250
Jiangsu Tianmu Lake Tourism Co. Ltd.
603136
Jinling Hotel Corporation Ltd.
601007
Lemon Tree Hotels Ltd.
LEMONTREE
Lijiang Yulong Tourism Co., Ltd.
002033
Marmaris Altinyunus Turistik Tesisler A.S.
MAALT
Marriott International Inc. - Class A
MAR
RLH Properties S.A.B. de C.V.
RLHA
Samhi Hotels Ltd.
SAMHI
Schloss Bangalore Ltd
THELEELA
Seobu T&D Co., Ltd.
006730
Shanghai Jinjiang International Hotels Co., Ltd.
600754
Shanghai Jinjiang International Hotels Co., Ltd.
900934
Shenzhen Overseas Chinese Town Co. Ltd.
000069
Shenzhen Quanxinhao Co., Ltd.
000007
Ssaw Hotels & Resorts Group Co. Ltd.
301073
Stamford Land Corporation Ltd.
H07
Sunborn International Plc
SBI
Taiba Investments Co.
4090
The Hongkong and Shanghai Hotels, Limited
0045
Tibet Tourism Co., Ltd.
600749
Whitbread plc
WTB
Wyndham Hotels & Resorts Inc.
WH
Xi'an Tourism Co., Ltd.
000610
Yunnan Tourism Co., Ltd.
002059