 CompanyGraph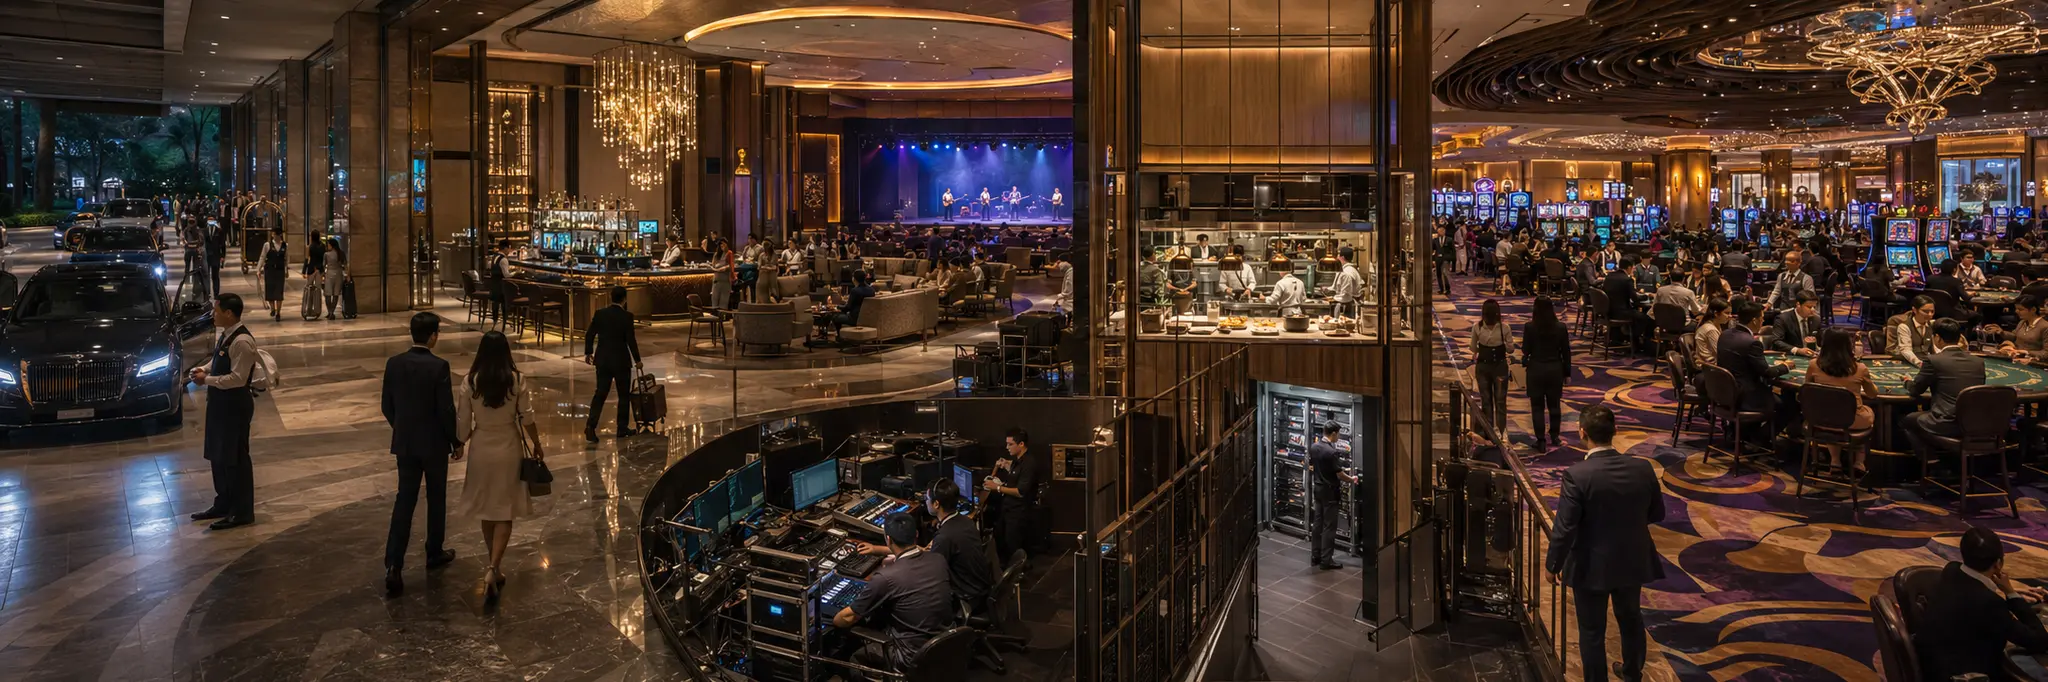
Heavy capital intensity in integrated property development creates long payback periods with fixed cost exposure, while gaming license scarcity and regulatory compliance function as structural barriers constraining both entry and operations.
The resorts and casinos industry operates at the intersection of real estate, hospitality, entertainment, and regulated gaming. Each property represents a large, illiquid capital commitment designed to concentrate multiple revenue streams in a single physical location. The structural logic is integration: by combining lodging, dining, entertainment, and gaming under unified operations, operators increase the duration and intensity of each customer visit, capturing a larger share of discretionary spending per trip.
Regulation shapes the competitive structure more directly than in most industries. Gaming licenses are scarce by design, as jurisdictions limit the number of operators to control social impacts and manage tax revenue. This scarcity creates structural barriers to entry that protect incumbents but constrain expansion. Each jurisdiction imposes its own rules on game types, payout ratios, operating hours, and advertising, requiring every property to operate within a unique regulatory envelope. The capital structure creates a distinctive risk profile: properties require years of planning and construction before generating revenue, and once built impose fixed costs for maintenance, staffing, and debt service regardless of visitation volume.
Online and mobile gaming introduces a structural tension for physical operators. Digital platforms offer gaming without the overhead of real estate, hospitality staff, and physical infrastructure, competing for the same consumer entertainment budget at lower marginal cost. Physical operators respond by emphasizing experiential dimensions that digital platforms cannot replicate: social environment, live entertainment, dining, and the integrated resort experience. The relative attractiveness of physical versus digital formats is shaped by regulation, technology adoption, and consumer preferences for convenience versus experience.
Structural Role
Coordinates the integration of real estate, hospitality services, and regulated gaming into controlled entertainment environments that concentrate consumer discretionary spending through the bundling of lodging, dining, entertainment, and wagering under unified property operations, subject to jurisdiction-specific gaming license scarcity.
Scale Differentiation
Large operators manage diversified property portfolios across multiple jurisdictions and countries, using loyalty program networks, cross-property referrals, and centralized procurement to distribute fixed costs across a broader revenue base. Mid-size firms operate across a handful of properties or jurisdictions, gaining procurement and marketing efficiencies while remaining exposed to regional demand patterns. Small operators hold single-property positions in regional or tribal gaming markets where local regulatory access defines the competitive boundary.
Financial Profile
Measured across the 27 companies in this industry with recorded financial statements. Each band spans the middle 90% of companies — 5th to 95th percentile — with the mark at the median. How wide a band runs is itself a reading: a tight band means the industry imposes its economics on every member; a wide one means outcomes differ sharply between its strongest and weakest companies.
Profitability
Gross margin44.4%median
10.7%94.8%
Operating margin14.7%median
0
-20.1%25.4%
Net margin5.6%median
0
-16.8%21.2%
Returns & efficiency
Return on equity8.3%median
0
-15.2%95.2%
Asset turnover0.46×median
0.25×0.70×
Free cash flow / revenue10.7%median
0
-25.9%24.0%
Balance sheet
Current ratio1.12×median
0.28×3.86×
Debt to equity2.69×median
0.01×9.44×
Reinvestment & payout
Capex / revenue6.7%median
0.1%19.7%
What marks this industry
Where this industry’s typical company sits against the typical company in every other industry we measure — metric by metric.
Debt to equity
2.69×typical industry 0.37×
2nd highest of 102 industries with this measure.
Free cash flow / revenue
10.7%typical industry 1.5%
7th highest of 101 industries with this measure.
Current ratio
1.12×typical industry 1.58×
10th lowest of 102 industries with this measure.
Operating margin
14.7%typical industry 8.1%
18th highest of 101 industries with this measure.
Scale
26
companies with recorded market value
$2.6B
median company · global median $1.2B
$414M – $19.6B
middle 90% of companies
$130.5B
combined market value
The largest member carries roughly 22% of the combined market value; half the companies sit under $2.6B.
Valuation ranges
Price to book2.37×median
0.75×44.20×
Price to earnings20.64×median
6.73×82.96×
EV / EBITDA9.16×median
0.05×21.87×
Bands are 5th–95th percentiles across this industry’s companies, computed from reported financial statements. Ratios are currency-free; money values are USD-normalized. These distributions describe how the industry is shaped — they are not a rating of it, and a company’s position inside them is not a forecast. Benchmark set computed 18 September 2026.
Connected Industries
Entertainment
Creates demand for
Live shows and events attract and retain guests
Gambling
Provides infrastructure for
Gaming operations are core to integrated resort model
Lodging
Creates demand for
Resort visitation drives room-night demand
Real Estate Development
Supplies inputs to
Property development underpins resort construction
Restaurants
Creates demand for
Travel Services
Creates demand for
Stocks
Altinyunus Cesme Turistik Inc.
AYCES
Bally's Corporation
BALY
Banyan Tree Holdings Ltd.
B58
Boyd Gaming Corporation
BYD
Caesars Entertainment, Inc.
CZR
Central Plaza Hotel Public Company Limited
CENTEL
Cirsa Enterprises, S.A.
CIRSA
Galaxy Entertainment Group Limited
0027
Grand Korea Leisure Co., Ltd.
114090
Hilton Grand Vacations Inc.
HGV
ITC Hotels Limited
ITCHOTELS
Kangwon Land, Inc.
035250
Las Vegas Sands Corp.
LVS
Lotte Tour Development Co., Ltd.
032350
Mahindra Holidays & Resorts India Ltd.
MHRIL
Marriott Vacations Worldwide Corporation
VAC
Melco International Development Limited
0200
MGM Resorts International
MGM
Monarch Casino & Resort Inc.
MCRI
Paradise Co. Ltd.
034230
PENN Entertainment, Inc.
PENN
Petrokent Turizm A.Ş.
PKENT
Red Rock Resorts Inc.
RRR
SJM Holdings Limited
0880
SkyCity Entertainment Group Limited
SKC
Vail Resorts Inc.
MTN
Wynn Macau Ltd.
1128
Wynn Resorts, Limited
WYNN