 CompanyGraph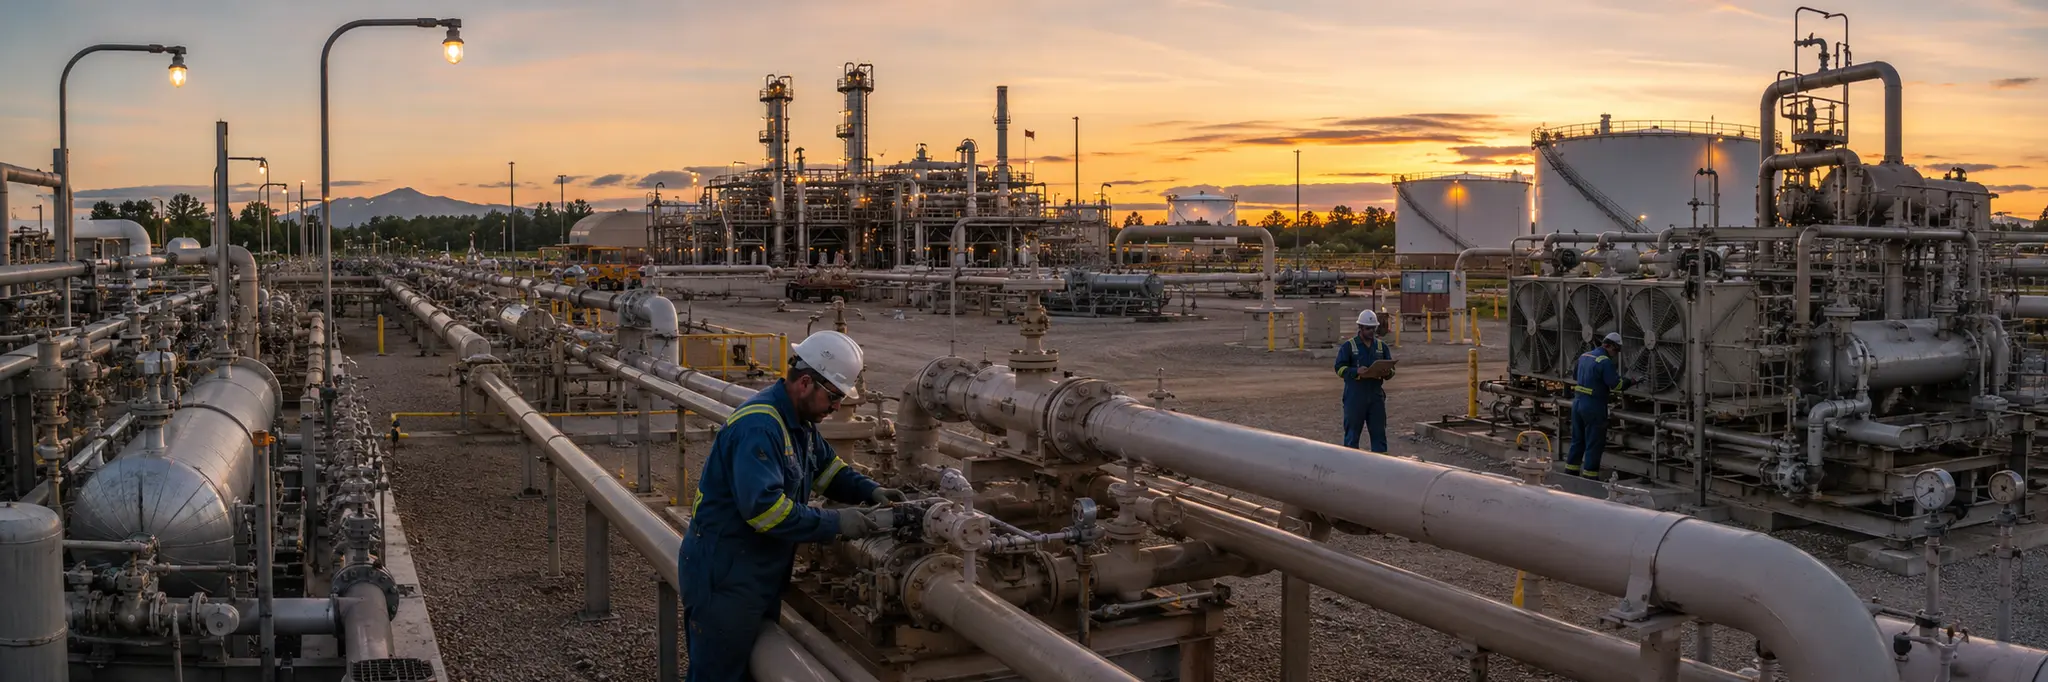
Massive upfront pipeline infrastructure investment with multi-decade payback horizons converts into fee-based revenue, constrained by regulatory permitting processes that can take years for new routes.
Oil and gas midstream companies own and operate the infrastructure that moves hydrocarbons from production sites to processing facilities, storage hubs, and end markets. This includes gathering systems near wellheads, long-haul transmission pipelines, natural gas processing plants that separate liquids from gas streams, storage terminals, and marine loading facilities. The core transformation receives raw hydrocarbons at the wellhead and delivers conditioned, transportable commodities to refineries and distribution points.
The business model is built around throughput fees rather than commodity ownership, with most revenue from per-unit volume charges under long-term contracts. This fee-based structure partially insulates operators from commodity price swings, but the insulation is incomplete: when prices fall far enough to reduce drilling activity, future volumes decline regardless of contractual minimums. The mismatch between multi-decade asset lives and variable production basin intensity makes capital discipline a persistent structural challenge, as gathering systems built during drilling booms may face underutilization as initial wells decline.
As the physical logistics layer of the energy supply chain, midstream infrastructure connects upstream production to downstream consumption. Regulatory permitting processes control the pace of new capacity, adding years to project timelines and creating uncertainty about whether proposed routes will be built. For incumbents, permitting difficulty limits competitive entry and supports existing route value; for the system as a whole, it means capacity additions often lag demand, creating periodic bottlenecks.
Structural Role
Connects upstream production sites to downstream refineries and end markets through transportation, storage, and processing infrastructure, serving as the physical logistics layer that enables hydrocarbon flows across the energy supply chain.
Scale Differentiation
Large midstream operators manage integrated pipeline networks spanning multiple basins and product types, offering shippers comprehensive transportation solutions and using network interconnections to optimize flow routing. Mid-size companies operate within specific basins or corridors where proximity to active production provides volume support. Smaller operators focus on gathering systems connecting individual wellheads to larger trunk lines, with economics tied closely to local drilling activity.
Constraint Archetype
Throughput-Bound Conversion
A regime where the rate at which physical inputs can be converted into outputs through fixed-capacity plant defines the economic ceiling.
Regulated Return Infrastructure
A regime where a regulatory authority sets allowable returns on invested capital in exchange for an obligation to provide reliable service to all customers within a defined territory.
Financial Profile
Measured across the 51 companies in this industry with recorded financial statements. Each band spans the middle 90% of companies — 5th to 95th percentile — with the mark at the median. How wide a band runs is itself a reading: a tight band means the industry imposes its economics on every member; a wide one means outcomes differ sharply between its strongest and weakest companies.
Profitability
Gross margin36.8%median
7.4%74.0%
Operating margin25.2%median
4.1%50.7%
Net margin21.4%median
0
-0.7%45.7%
Returns & efficiency
Return on equity11.6%median
0
-2.2%47.4%
Asset turnover0.30×median
0.12×1.10×
Free cash flow / revenue17.7%median
0
-99.3%48.0%
Balance sheet
Current ratio1.33×median
0.51×10.30×
Debt to equity0.78×median
0.02×3.47×
Reinvestment & payout
R&D / revenue0.2%median
0.0%4.4%
Capex / revenue15.3%median
0.1%100.9%
What marks this industry
Where this industry’s typical company sits against the typical company in every other industry we measure — metric by metric.
R&D / revenue
0.2%typical industry 3.1%
2nd lowest of 77 industries with this measure.
Free cash flow / revenue
17.7%typical industry 1.5%
3rd highest of 101 industries with this measure.
Capex / revenue
15.3%typical industry 3.8%
4th highest of 101 industries with this measure.
Net margin
21.4%typical industry 5.4%
6th highest of 101 industries with this measure.
Scale
51
companies with recorded market value
$3.9B
median company · global median $1.2B
$443M – $67.4B
middle 90% of companies
$784.2B
combined market value
The largest member carries roughly 14% of the combined market value; half the companies sit under $3.9B.
Valuation ranges
Price to book2.03×median
0.59×9.59×
Price to earnings15.73×median
4.85×31.14×
EV / EBITDA11.46×median
3.16×22.01×
Bands are 5th–95th percentiles across this industry’s companies, computed from reported financial statements. Ratios are currency-free; money values are USD-normalized. These distributions describe how the industry is shaped — they are not a rating of it, and a company’s position inside them is not a forecast. Benchmark set computed 18 September 2026.
Connected Industries
Chemicals
Distributes for
Delivers NGL feedstocks to petrochemical plants
Oil & Gas E&P
Provides infrastructure for
Gathering systems enable production from wellheads
Oil & Gas Refining & Marketing
Distributes for
Transports crude oil to refineries
Utilities Independent Power Producers
Distributes for
Utilities Regulated Gas
Distributes for
Delivers processed natural gas to utilities
Stocks
Anhui Province Natural Gas Co., Ltd.
603689
Antero Midstream Corporation
AM
Cheniere Energy Inc.
LNG
China Merchants Energy Group Co., Ltd.
601872
CMBTOO
CMBTOO
Cosco Shipping Energy Transportation Co., Ltd.
600026
Csc Nanjing Tanker Corporation
601975
DHT Holdings Inc.
DHT
Dorian LPG Ltd.
LPG
Dt Midstream Inc.
DTM
Enbridge Inc.
ENB
ESENTIAII
ESENTIAII
Euronav NV
EURN
Excelerate Energy Inc.
EE
Flex LNG Ltd.
FLNG
Frontline
FROO
Gibson Energy Inc.
GEI
Golar LNG Ltd.
GLNG
Hess Midstream LP
HESM
International Seaways Inc.
INSW
Jiangxi Jovo Energy Co., Ltd.
605090
Keyera Corp.
KEY
Kinder Morgan, Inc.
KMI
Kinetik Holdings Inc.
KNTK
KNOT Offshore Partners L.P.
KNOP
Koninklijke Vopak N.V.
VPK
Naturelgaz Sanayi ve Ticaret A.Ş.
NTGAZ
Navigator Holdings Ltd.
NVGS
New Fortress Energy Inc.
NFE
Nordic American Tankers Ltd.
NAT
ONEOK, Inc.
OKE
Pembina Pipeline Corporation
PPL
Qatar Gas Transport Company Ltd.
QGTS
Scorpio Tankers Inc.
STNG
Senton Energy Co. Ltd.
001331
Shaanxi Provincial Natural Gas Co., Ltd.
002267
Shanxi Guoxin Energy Corp.
600617
Shanxi Guoxin Energy Corporation
900913
Sinopec Kantons Holdings Limited
0934
South Bow Corporation
SOBO
Sovcomflot OAO
FLOT
Summit Midstream Corporation
SMC
Suncast Solar Energy Inc.
SUNC
Targa Resources Corp.
TRGP
TC Energy Corporation
TRP
Teekay Corporation Ltd.
TK
Teekay Tankers Ltd
TNK
The Williams Companies, Inc.
WMB
Topaz Energy Corp.
TPZ
TORM PLC
TRMD.A
TORM plc Class A
TRMD
Transportadora de Gas del Norte S.A.
TGNO4
Tsakos Energy Navigation Ltd.
TEN
Venture Global Inc.
VG
Viper Energy, Inc.
VNOM
Zhuhai Winbase International Chemical Tank Terminal Co. Ltd.
002492