 CompanyGraph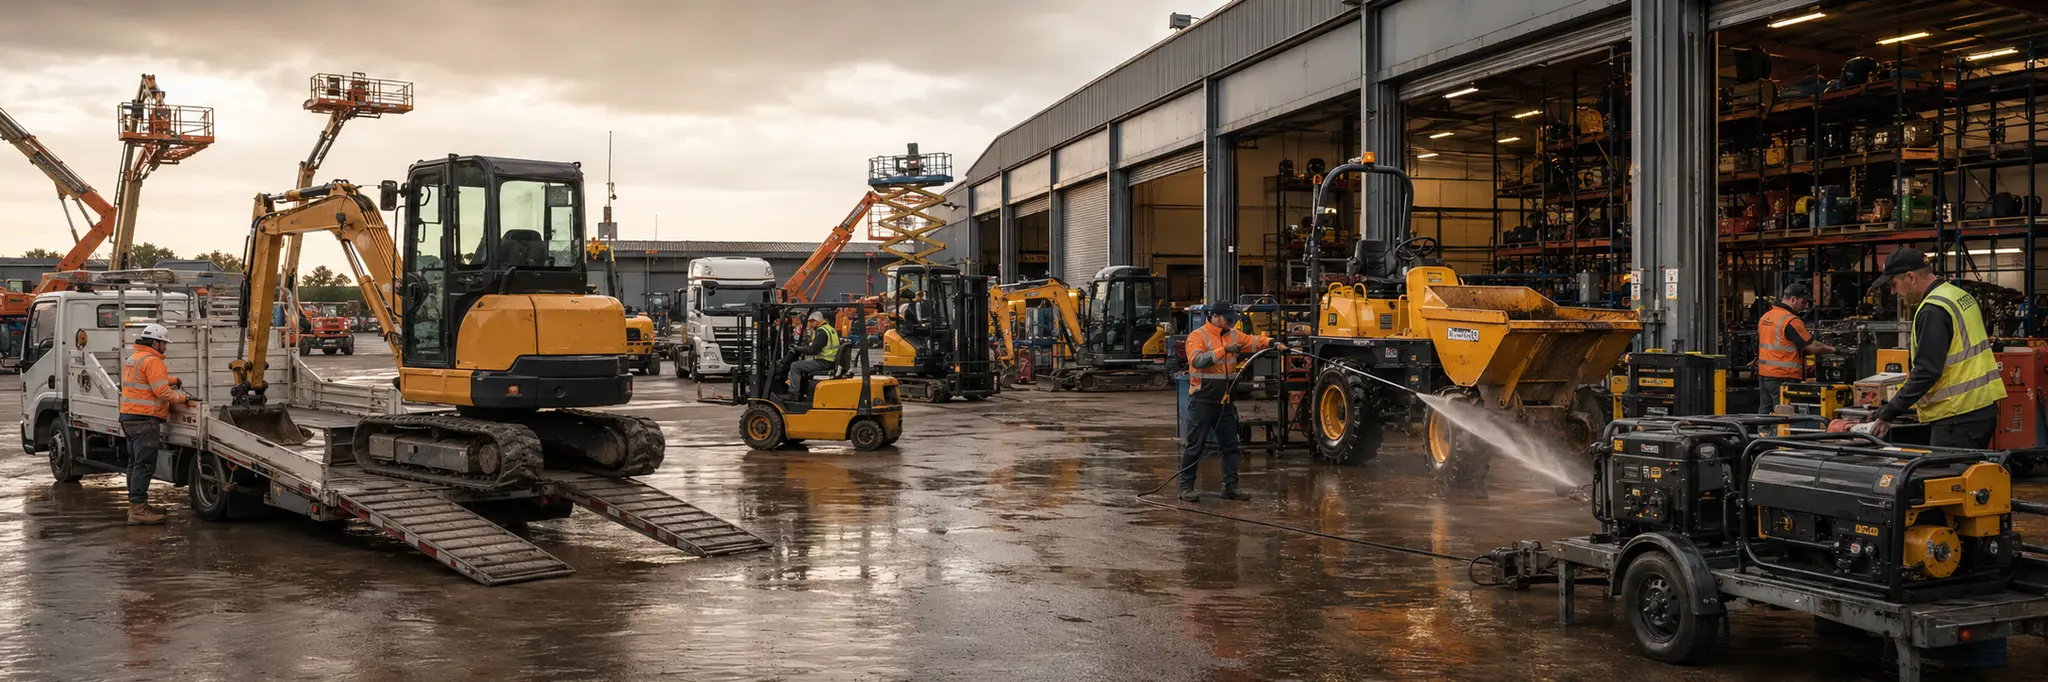
Large upfront fleet acquisition costs recovered over the rental life bind returns to utilization rates that determine whether fixed ownership costs spread across sufficient revenue-generating periods.
Rental and leasing companies own fleets of physical assets including construction equipment, commercial vehicles, tools, and industrial equipment, providing temporary access in exchange for rental fees. The structural role is to decouple the use of capital-intensive equipment from its ownership, allowing businesses to match equipment capacity to variable workloads without permanent capital commitments. This function is most valuable when demand is project-based, seasonal, or uncertain, conditions where owning equipment would create idle capacity during low-demand periods.
The central operational variables are utilization and residual value. Each fleet asset generates revenue only when rented but carries ownership costs continuously, making aggregate fleet utilization the primary driver of unit-level economics. Fleet sizing decisions are made months or years in advance through purchasing commitments while demand fluctuates on shorter cycles. When assets reach the end of their optimal rental life, they are sold into secondary markets where the price received depends on asset condition, used equipment supply and demand dynamics, and the rate of technological or regulatory obsolescence. This creates a dual exposure where both the rental period and the disposition event determine total asset returns.
The rent-versus-buy decision made by customers is the demand-side mechanism determining the industry's addressable market. When financing costs rise, economic uncertainty increases, or project durations are short, renting becomes more attractive relative to ownership. When interest rates are low and economic confidence is high, more businesses choose to purchase directly, reducing rental demand. The industry exists in a structural relationship with the broader equipment ownership market, expanding and contracting as economic conditions shift the relative attractiveness of temporary access versus permanent ownership.
Structural Role
Decouples the use of capital-intensive physical assets from their ownership, allowing businesses and consumers to obtain equipment and vehicle capacity without permanent capital commitment while the lessor absorbs asset lifecycle management, utilization risk, and residual value exposure.
Scale Differentiation
Large rental and leasing companies operate extensive fleets across broad geographies, using network density to offer delivery flexibility and equipment availability that smaller operators cannot match, supported by fleet management technology, maintenance infrastructure, and purchasing power with original equipment manufacturers. Mid-size operators specialize in specific asset categories such as construction equipment, commercial trucks, or IT hardware where fleet composition expertise provides differentiation. Smaller firms compete on local availability, relationship-based service, and willingness to serve niche asset types or short-duration needs.
Financial Profile
Measured across the 42 companies in this industry with recorded financial statements. Each band spans the middle 90% of companies — 5th to 95th percentile — with the mark at the median. How wide a band runs is itself a reading: a tight band means the industry imposes its economics on every member; a wide one means outcomes differ sharply between its strongest and weakest companies.
Profitability
Gross margin38.0%median
1.3%87.1%
Operating margin16.9%median
0
-4.6%37.7%
Net margin5.1%median
0
-10.9%28.6%
Returns & efficiency
Return on equity9.8%median
0
-10.2%20.6%
Asset turnover0.40×median
0.13×0.78×
Free cash flow / revenue0.7%median
0
-61.5%33.2%
Balance sheet
Current ratio1.32×median
0.44×6.14×
Debt to equity2.21×median
0.24×7.93×
Reinvestment & payout
Capex / revenue7.5%median
0.4%55.6%
What marks this industry
Where this industry’s typical company sits against the typical company in every other industry we measure — metric by metric.
Debt to equity
2.21×typical industry 0.37×
5th highest of 102 industries with this measure.
Operating margin
16.9%typical industry 8.1%
14th highest of 101 industries with this measure.
Capex / revenue
7.5%typical industry 3.8%
16th highest of 101 industries with this measure.
Current ratio
1.32×typical industry 1.58×
17th lowest of 102 industries with this measure.
Scale
38
companies with recorded market value
$1.5B
median company · global median $1.2B
$264M – $24.0B
middle 90% of companies
$221.4B
combined market value
The largest member carries roughly 29% of the combined market value; half the companies sit under $1.5B.
Valuation ranges
Price to book1.53×median
0.67×4.01×
Price to earnings12.92×median
6.59×271.70×
EV / EBITDA bands are not drawn for this industry. Many members run negative values there, and a percentile band across mixed signs has no honest reading — a range is shown only where it means something.
Bands are 5th–95th percentiles across this industry’s companies, computed from reported financial statements. Ratios are currency-free; money values are USD-normalized. These distributions describe how the industry is shaped — they are not a rating of it, and a company’s position inside them is not a forecast. Benchmark set computed 18 September 2026.
Connected Industries
Credit Services
Creates demand for
Fleet financing and leasing capital
Engineering & Construction
Provides tooling for
Provides construction equipment on temporary basis
Farm & Heavy Construction Machinery
Creates demand for
Purchases equipment fleets from manufacturers
Oil & Gas E&P
Provides tooling for
Leases equipment for field operations
Specialty Industrial Machinery
Creates demand for
Trucking
Provides tooling for
Leases commercial vehicles to fleet operators
Stocks
Adi Sarana Armada Tbk.
ASSA
AerCap Holdings N.V.
AER
Air Lease Corporation
AL
Armac Locacao Logistica e Servicos S.A.
ARML3
Avation PLC
AVAP
Avis Budget Group, Inc.
CAR
Ayvens SA
AYV
Bohai Leasing Co., Ltd.
000415
China Development Bank Financial Leasing Co., Ltd.
1606
CTS Co., Ltd.
4345
Custom Truck One Source, Inc.
CTOS
Dida Inc.
2559
Emeco Holdings Limited
EHL
EquipmentShare.com Inc.
EQPT
Escar Filo Kiralama Hizmetleri A.S.
ESCAR
GATX Corporation
GATX
Gecoss Corp
9991
Herc Holdings Inc.
HRI
Hertz Global Holdings, Inc.
HTZ
HSS Hire Group plc
HSS
Japan Investment Adviser Co., Ltd.
7172
LDR Turizm A.S.
LIDER
Localiza Rent a Car S.A.
RENT3
Lotte Rental Co., Ltd.
089860
McGrath RentCorp
MGRC
Mills Estruturas e Serviços de Engenharia S.A.
MILS3
Movida Participações S.A.
MOVI3
Prog Holdings Inc.
PRG
ProService Building Services Marketplace plc
PRO
Ryder System Inc.
R
Sanghvi Movers Ltd.
SANGHVIMOV
Shaanxi Construction Machinery Co., Ltd.
600984
Simpar S.A.
SIMH3
Speedy Hire plc
SDY
U-Haul Holding Co.
UHAL.B
U-Haul Holding Company
UHAL
United Rentals, Inc.
URI
Vamos Locação de Caminhões e Máquinas S.A.
VAMO3
Vestis Corporation
VSTS
Vp plc
VP
WillScot Holdings Corporation
WSC
Zeda Limited
ZZD
Zhejiang Haikong Nanke Huati Co., Ltd.
603300
ZIGUP plc
ZIG