 CompanyGraph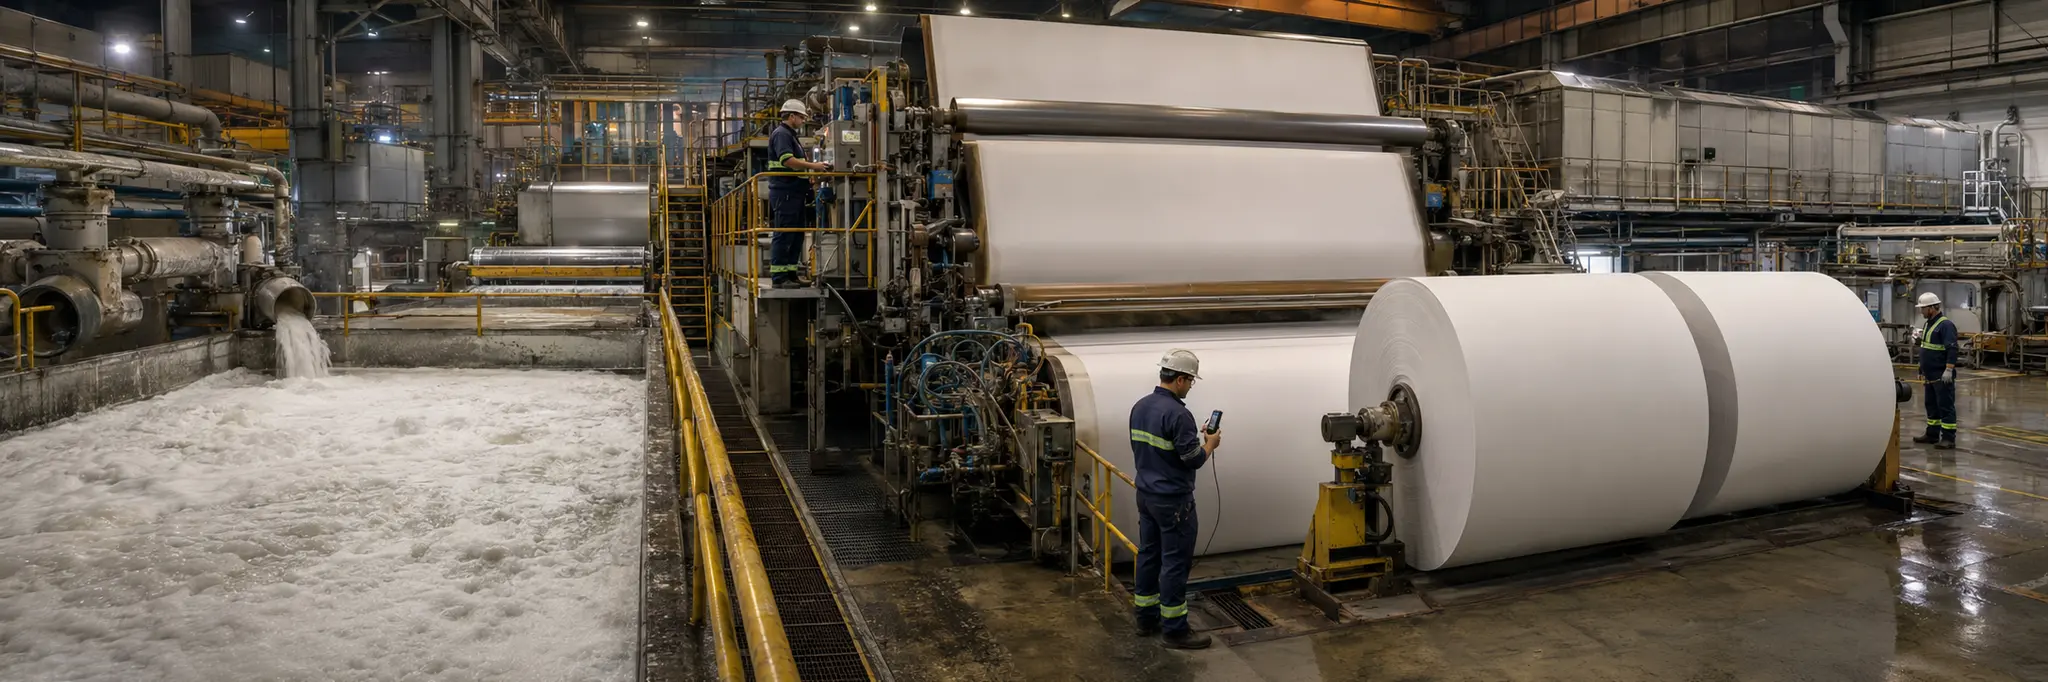
Capital-intensive mill infrastructure with decades-long asset lives requires continuous high utilization to achieve acceptable unit economics, while fiber supply depends on forestry cycles and recycled collection systems.
The paper and paper products industry converts wood fiber and recycled pulp into standardized flat substrates through pulping, bleaching, sheet formation, and drying. The process begins with fiber sourcing from managed forests or recycled paper collection systems, followed by chemical or mechanical pulping to separate fibers, which are then formed into sheets, pressed, dried, and finished to specification. Output grades span containerboard and corrugated materials for packaging, printing and writing papers, tissue and hygiene products, and specialty grades for industrial use.
The industry's structure is defined by extreme capital intensity, high energy consumption, and continuous-process operations. Paper machines require sustained high-utilization rates because fixed costs of depreciation, maintenance, and staffing accrue regardless of production volume. Fiber supply introduces its own constraints: virgin fiber depends on forestry cycles subject to seasonal, regulatory, and biological limitations, while recycled fiber degrades with each reuse cycle, maintaining a permanent link to virgin fiber supply regardless of recycling rates. Water, both as an essential process input and an environmental compliance obligation, shapes mill siting and operating costs.
As an upstream and midstream processor, the industry links forestry and fiber recovery systems to downstream converting and end-use markets. Structural demand divergence is reshaping the product mix: printing and writing grades face secular decline from digital substitution, while packaging grades benefit from e-commerce growth. This divergence drives capital reallocation, including machine conversions from shrinking to growing grades, reflecting the industry's adaptation of fixed, long-lived assets to shifting downstream demand patterns.
Structural Role
Converts wood fiber into flat, standardized substrates that serve as foundational materials for packaging, communication, hygiene, and industrial applications, linking forestry and recycled fiber supply to downstream converting and end-use markets.
Scale Differentiation
Large paper companies operate integrated systems spanning fiber procurement, pulp production, paper manufacturing, and converting operations, with modern high-efficiency machines that produce at lower cost per ton. Mid-size producers operate fewer mills and may specialize in specific paper grades. Smaller producers compete on freight advantage in local markets or specialization in niche grades that large mills find uneconomical to produce in short runs.
Financial Profile
Measured across the 45 companies in this industry with recorded financial statements. Each band spans the middle 90% of companies — 5th to 95th percentile — with the mark at the median. How wide a band runs is itself a reading: a tight band means the industry imposes its economics on every member; a wide one means outcomes differ sharply between its strongest and weakest companies.
Profitability
Gross margin17.7%median
0
-8.0%47.5%
Operating margin4.7%median
0
-17.7%20.5%
Net margin3.0%median
0
-40.4%17.3%
Returns & efficiency
Return on equity3.4%median
0
-71.0%13.4%
Asset turnover0.55×median
0.14×1.19×
Free cash flow / revenue-3.2%median
0
-48.8%20.4%
Balance sheet
Current ratio1.48×median
0.20×3.38×
Debt to equity0.65×median
0.04×3.68×
Reinvestment & payout
R&D / revenue2.6%median
0.4%4.2%
Capex / revenue6.8%median
0.7%20.7%
What marks this industry
Where this industry’s typical company sits against the typical company in every other industry we measure — metric by metric.
Return on equity
3.4%typical industry 7.1%
9th lowest of 102 industries with this measure.
Gross margin
17.7%typical industry 29.4%
14th lowest of 101 industries with this measure.
Operating margin
4.7%typical industry 8.1%
16th lowest of 101 industries with this measure.
Capex / revenue
6.8%typical industry 3.8%
19th highest of 101 industries with this measure.
Scale
41
companies with recorded market value
$873M
median company · global median $1.2B
$301M – $8.8B
middle 90% of companies
$84.9B
combined market value
The largest member carries roughly 18% of the combined market value; half the companies sit under $873M.
Valuation ranges
Price to book1.24×median
0.50×12.73×
Price to earnings21.74×median
8.54×155.98×
EV / EBITDA bands are not drawn for this industry. Many members run negative values there, and a percentile band across mixed signs has no honest reading — a range is shown only where it means something.
Bands are 5th–95th percentiles across this industry’s companies, computed from reported financial statements. Ratios are currency-free; money values are USD-normalized. These distributions describe how the industry is shaped — they are not a rating of it, and a company’s position inside them is not a forecast. Benchmark set computed 18 September 2026.
Connected Industries
Business Equipment & Supplies
Supplies inputs to
Household & Personal Products
Supplies inputs to
Supplies tissue and hygiene paper products
Lumber & Wood Production
Creates demand for
Consumes wood fiber from forestry operations
Packaging & Containers
Supplies inputs to
Supplies containerboard and paperboard substrates
Publishing
Supplies inputs to
Supplies printing and writing paper
Stocks
Billerud AB (publ)
BILL
Cre8 Direct Ningbo Co., Ltd.
300703
Empresas CMPC S.A.
CMPC
ENCE Energía y Celulosa, S.A.
ENC
Fujian Qingshan Paper Industries Co., Ltd.
600103
Guangdong Guanhao High-Tech Co., Ltd.
600433
Guangdong Songyang Recycle Resources Co., Ltd.
603863
Hangzhou Huawang New Materials Co., Ltd.
605377
Jk Paper Ltd.
JKPAPER
Klabin S.A.
KLBN3
KPP Group Holdings Co., Ltd.
9274
Meili Cloud Computing Co., Ltd.
000815
Middle East Paper Company
1202
Minfeng Special Paper Co., Ltd.
600235
Mondi plc
MNDI
Mudanjiang Hengfeng Paper Co., Ltd.
600356
Qifeng New Material Co., Ltd.
002521
Shandong Bohui Paper Industry Co., Ltd.
600966
Shandong Chenming Paper Holdings Ltd.
000488
Shandong Chenming Paper Holdings Ltd.
200488
Shandong Huatai Paper Co., Ltd.
600308
Shandong Sun Paper Co., Ltd.
002078
Shanying International Holdings Co., Ltd.
600567
Shindaeyang Paper Co., Ltd.
016590
Suzano S.A.
SUZB3
Svenska Cellulosa AB SCA
SCA.B
Sylvamo Corporation
SLVM
The Navigator Company, S.A.
NVG
Tokushu Tokai Paper Co., Ltd.
3708
UPM-Kymmene Oyj
UPM
West Coast Paper Mills Ltd.
WSTCSTPAPR
Wuzhou Special Paper Group Co., Ltd.
605007
Xiamen Anne Corp
002235
Xianhe Co., Ltd.
603733
YFY Inc.
1907
Yibin Paper Industry Co., Ltd.
600793
Yueyang Forest & Paper Co., Ltd.
600963
Zhejiang Great Shengda Packaging Co., Ltd.
603687
Zhejiang Jingxing Paper Co., Ltd.
002067
Zhejiang Kan Specialities Co., Ltd.
002012
Zhejiang Zhongxin Environmental Protection Co., Ltd.
603091