 CompanyGraph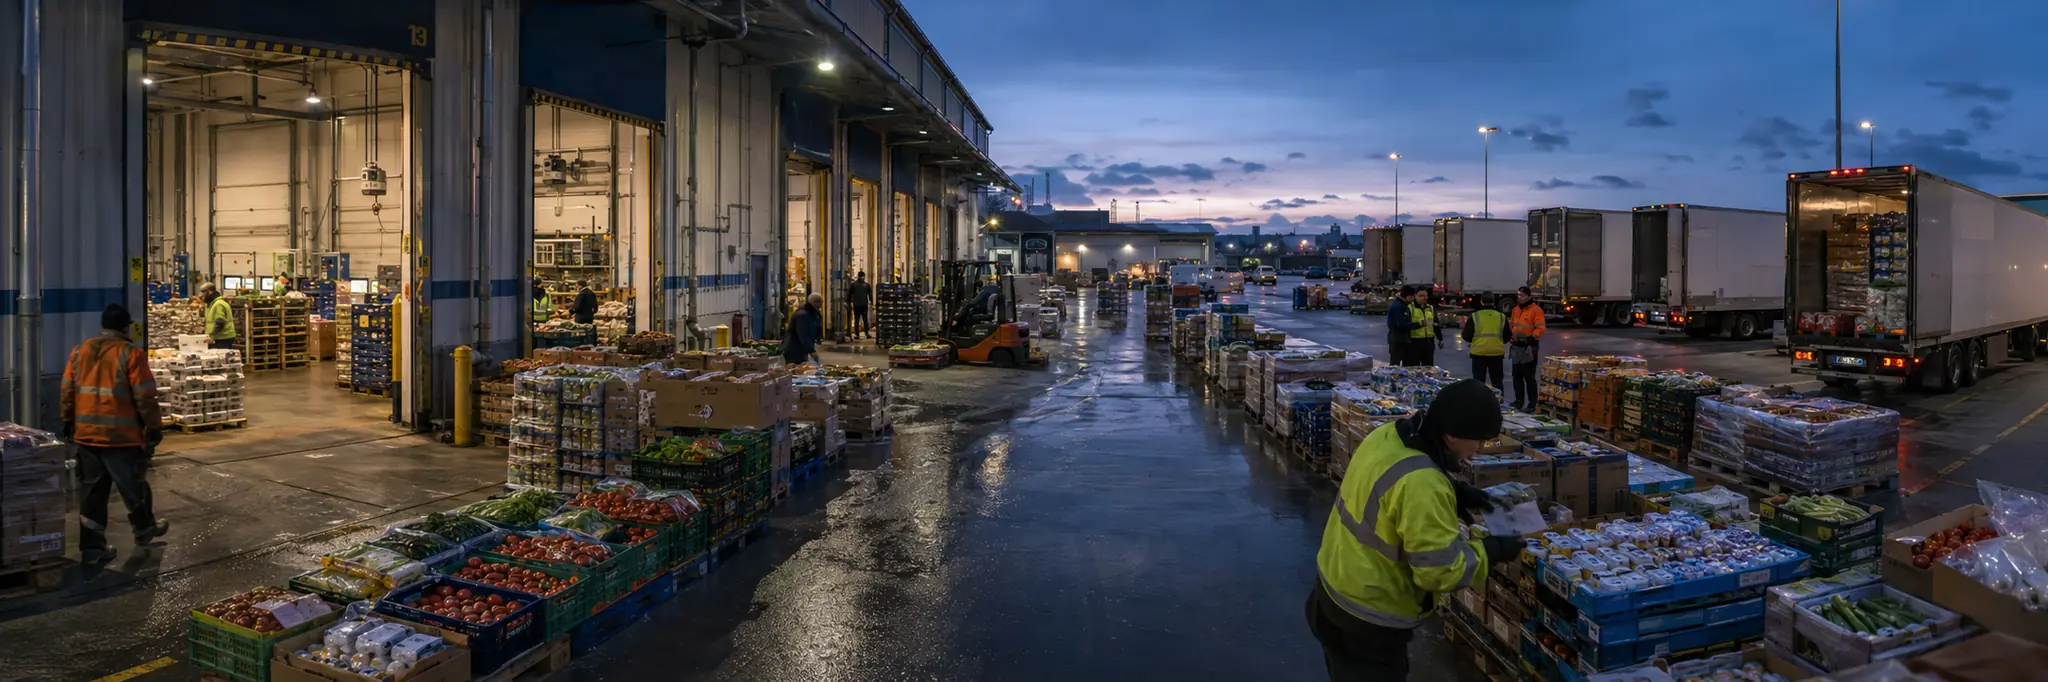
Cold chain integrity requirements impose continuous capital and operating costs throughout the handling chain, while perishable inventory creates time pressure where spoilage is the direct cost of any delay.
The food distribution industry aggregates products from manufacturers and producers, consolidates them into customized orders through temperature-controlled warehousing, and delivers assorted loads to dispersed consumption endpoints. The transformation bridges the structural mismatch between centralized bulk production and fragmented consumption across thousands of locations with distinct ordering patterns, delivery requirements, and product needs.
The structure is defined by cold chain integrity requirements, perishable inventory pressure, and thin margins that demand logistical efficiency at every stage. Route density and warehouse throughput are the primary determinants of unit economics, both of which improve with scale and geographic concentration. Food safety regulations impose traceability and handling standards throughout the chain, adding compliance costs that apply uniformly regardless of operator size.
As a midstream intermediary, food distribution connects upstream producers with downstream retailers, restaurants, and institutions. Product mix shapes economics significantly, with commodity items providing volume at thin margins and fresh categories offering higher margins but imposing greater handling complexity and waste risk. The operational challenge is managing both categories within the same distribution network while maintaining the delivery reliability and fill rates that sustain customer retention.
Structural Role
Bridges the structural gap between centralized food production and dispersed consumption endpoints by absorbing the aggregation, cold chain, and last-mile logistics complexity that neither manufacturers nor end customers could efficiently manage independently.
Scale Differentiation
Large-scale distributors operate national logistics networks with tens of thousands of products, using route optimization, automated warehousing, and purchasing scale to achieve cost structures that smaller competitors cannot match while offering one-stop procurement convenience. Mid-sized distributors cover broader geographic areas with wider product assortments, investing in fleet management and warehouse infrastructure to balance service levels with cost efficiency. Small distributors serve local or regional markets with specialized product focus, relying on supplier relationships and service flexibility to retain customers.
Financial Profile
Measured across the 26 companies in this industry with recorded financial statements. Each band spans the middle 90% of companies — 5th to 95th percentile — with the mark at the median. How wide a band runs is itself a reading: a tight band means the industry imposes its economics on every member; a wide one means outcomes differ sharply between its strongest and weakest companies.
Profitability
Gross margin16.9%median
7.0%32.4%
Operating margin3.4%median
0
-0.0%11.9%
Net margin1.8%median
0
-3.2%16.4%
Returns & efficiency
Return on equity7.4%median
0
-78.4%27.3%
Asset turnover2.00×median
0.23×5.09×
Free cash flow / revenue1.5%median
0
-14.2%5.8%
Balance sheet
Current ratio1.41×median
0.62×14.79×
Debt to equity0.73×median
0.01×2.90×
Reinvestment & payout
Capex / revenue2.1%median
0.4%20.2%
Dividend payout54.7%median
10.3%160.2%
What marks this industry
Where this industry’s typical company sits against the typical company in every other industry we measure — metric by metric.
Asset turnover
2.00×typical industry 0.59×
1st highest of 101 industries with this measure.
Net margin
1.8%typical industry 5.4%
5th lowest of 101 industries with this measure.
Operating margin
3.4%typical industry 8.1%
5th lowest of 101 industries with this measure.
Gross margin
16.9%typical industry 29.4%
12th lowest of 101 industries with this measure.
Scale
24
companies with recorded market value
$1.8B
median company · global median $1.2B
$334M – $22.1B
middle 90% of companies
$140.7B
combined market value
The largest member carries roughly 28% of the combined market value; half the companies sit under $1.8B.
Valuation ranges
Price to book2.07×median
0.63×13.46×
Price to earnings19.70×median
9.98×53.90×
EV / EBITDA11.89×median
5.17×57.40×
Bands are 5th–95th percentiles across this industry’s companies, computed from reported financial statements. Ratios are currency-free; money values are USD-normalized. These distributions describe how the industry is shaped — they are not a rating of it, and a company’s position inside them is not a forecast. Benchmark set computed 18 September 2026.
Stocks
Bid Corporation Limited
BID
Bunzl plc
BNZL
Calavo Growers, Inc.
CVGW
China Wantian Holdings Ltd.
1854
Cj Freshway Corp.
051500
Cp Axtra Public Co. Ltd.
CPAXT
Dongsuh Companies Inc.
026960
Hyundai Glovis Co., Ltd.
005440
Jerónimo Martins, SGPS, S.A.
JMT
Jinzi Ham Co. Ltd.
002515
Kitwave Group plc
KITW
Maiquer Group Co., Ltd.
002719
MARR S.p.A.
MARR
Mission Produce Inc.
AVO
Orsero S.p.A.
ORS
Performance Food Group Co.
PFGC
Pinlive Foods Co., Ltd.
300892
Shenzhen Agricultural Power Co., Ltd.
000061
Sligro Food Group N.V.
SLIGR
Spar Group Limited
SPP
Sysco Corporation
SYY
The Andersons, Inc.
ANDE
The Chefs' Warehouse, Inc.
CHEF
United Natural Foods Inc.
UNFI
Us Foods Holding Corp.
USFD
Yokorei Co., Ltd.
2874
Zhejiang Dongri Co., Ltd.
600113