 CompanyGraph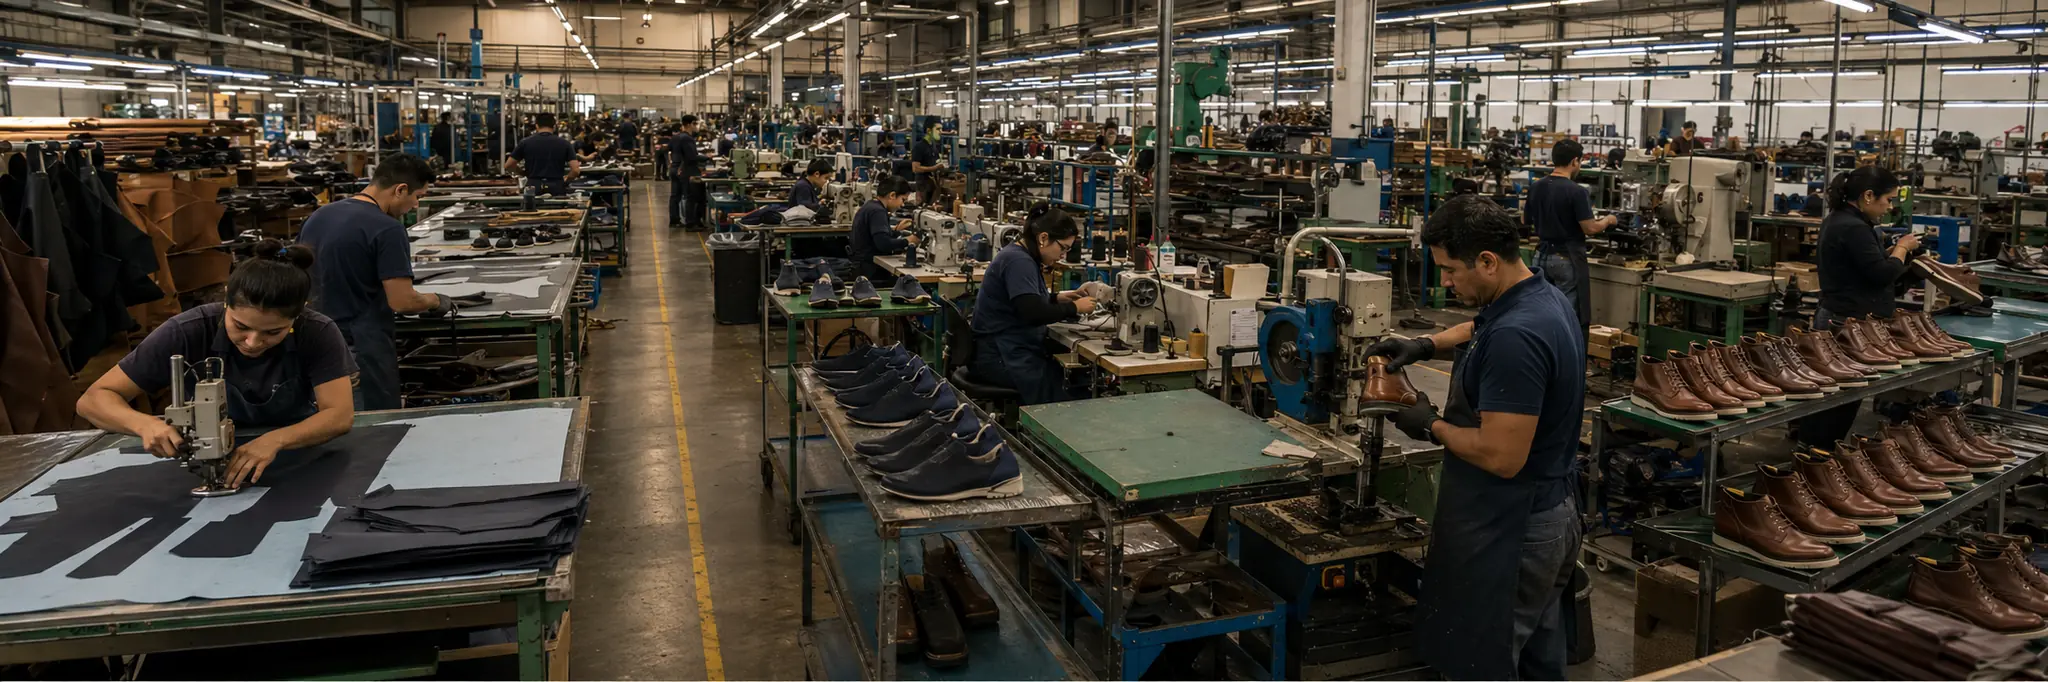
Seasonal inventory commitment months before observed demand concentrates risk in forecasting accuracy, while brand equity maintenance demands continuous marketing investment with uncertain returns.
The footwear and accessories industry converts commodity materials through design, offshore manufacturing, and brand development into finished consumer products where brand perception rather than material cost is the primary determinant of pricing power. The transformation spans design decisions made twelve to eighteen months before products reach consumers, manufacturing orders placed six to nine months in advance, and sell-through data arriving only after inventory has been distributed across channels.
The structure is defined by seasonal commitment-information mismatches, continuous brand investment requirements, and offshore manufacturing dependencies. Inventory must be committed before demand is observed, consumer taste shifts can rapidly devalue positioned inventory, and the geographic separation between production centers in Asia and consumption markets creates logistical complexity and trade policy exposure. Distribution architecture directly shapes margin capture, with direct-to-consumer channels retaining more value but requiring capital investment and inventory risk absorption.
As a downstream branded manufacturer, the industry occupies the position between midstream material suppliers and end consumers. Scale differentiates operators primarily through brand portfolio breadth, distribution channel control, and marketing investment capacity, with larger operators able to sustain owned retail and e-commerce infrastructure while smaller firms depend on wholesale channel access and creative differentiation.
Structural Role
Coordinates the conversion of commodity material inputs into branded consumer products where design identity, brand perception, and distribution architecture determine pricing power and market position across performance, fashion, and luxury segments.
Scale Differentiation
Large footwear and accessories companies operate global brand portfolios, control distribution through owned retail and e-commerce channels, and invest heavily in marketing and endorsement relationships to sustain brand positioning. Mid-size companies focus on a single brand or product category where design identity and channel relationships create loyal customer segments. Smaller firms compete through niche positioning, artisanal production, or trend responsiveness, relying on creative distinctiveness rather than marketing scale.
Financial Profile
Measured across the 51 companies in this industry with recorded financial statements. Each band spans the middle 90% of companies — 5th to 95th percentile — with the mark at the median. How wide a band runs is itself a reading: a tight band means the industry imposes its economics on every member; a wide one means outcomes differ sharply between its strongest and weakest companies.
Profitability
Gross margin39.0%median
14.3%59.8%
Operating margin8.2%median
0
-28.9%23.9%
Net margin6.5%median
0
-130.8%20.2%
Returns & efficiency
Return on equity8.8%median
0
-86.7%23.7%
Asset turnover0.91×median
0.28×1.47×
Free cash flow / revenue0.7%median
0
-30.3%20.3%
Balance sheet
Current ratio1.90×median
0.88×5.39×
Debt to equity0.37×median
0.02×2.21×
Reinvestment & payout
R&D / revenue2.1%median
0.3%6.0%
Capex / revenue2.6%median
0.5%13.4%
What marks this industry
Where this industry’s typical company sits against the typical company in every other industry we measure — metric by metric.
Asset turnover
0.91×typical industry 0.59×
17th highest of 101 industries with this measure.
Scale
48
companies with recorded market value
$627M
median company · global median $1.2B
$271M – $24.6B
middle 90% of companies
$283.8B
combined market value
The largest member carries roughly 38% of the combined market value; half the companies sit under $627M.
Valuation ranges
Price to book2.14×median
0.46×8.63×
Price to earnings14.79×median
4.24×269.78×
EV / EBITDA bands are not drawn for this industry. Many members run negative values there, and a percentile band across mixed signs has no honest reading — a range is shown only where it means something.
Bands are 5th–95th percentiles across this industry’s companies, computed from reported financial statements. Ratios are currency-free; money values are USD-normalized. These distributions describe how the industry is shaped — they are not a rating of it, and a company’s position inside them is not a forecast. Benchmark set computed 18 September 2026.
Connected Industries
Advertising Agencies
Creates demand for
Brand marketing and endorsement campaigns
Apparel Retail
Creates demand for
Retail channels distribute footwear and accessories
Department Stores
Creates demand for
Internet Retail
Creates demand for
E-commerce is a growing distribution channel
Textile Manufacturing
Creates demand for
Synthetic and natural textiles used in production
Stocks
361 Degrees International Ltd.
1361
adidas AG
ADS
Anhui Anli Material Technology Co. Ltd.
300218
Anhui Korrun Co., Ltd.
300577
Arezzo Industria e Comercio S.A.
ARZZ3
Azzas 2154 S.A.
AZZA3
Bata India Ltd.
BATAINDIA
Birkenstock Holding plc
BIRK
Campus Activewear Ltd.
CAMPUS
C.banner International Holdings Limited
1028
Crocs, Inc.
CROX
Deckers Outdoor Corporation
DECK
Designer Brands Inc.
DBI
Feng Tay Enterprise Co., Ltd.
9910
Forward Industries Inc.
FORD
Forward Industries, Inc.
FWDI
Fossil Group Inc.
FOSL
Fulgent Sun International Co. Ltd.
9802
Golden Solar New Energy Technology Holdings Limited
1121
Grendene S.A.
GRND3
Guangdong Wanlima Investment Co., Ltd.
300591
Harson Trading China Co., Ltd.
603958
Huali Industrial Group Co., Ltd.
300979
Js Corp.
194370
Nike, Inc. - Class B
NKE
On Holding AG
ONON
Paiho Shih Holdings Corporation
8404
Pou Sheng International Holdings Limited
3813
PUMA SE
PUM
Redtape Ltd.
REDTAPE
Relaxo Footwears Ltd.
RELAXO
Rocky Brands Inc.
RCKY
Samsonite International S.A.
1910
Sanofi SA
SAN
Shandong Tongda Island New Material Co., Ltd.
300321
Stella International Holdings Ltd.
1836
Steven Madden Ltd.
SHOO
Topscore Fashion Co. Ltd.
603608
V.I.P. Industries Ltd.
VIPIND
Vulcabras S.A.
VULC3
Wolverine World Wide Inc.
WWW
Wuxi Double Elephant Micro Fibre Material Co. Ltd.
002395
Yue Yuen Industrial
0551
Zhejiang Aokang Shoes Co., Ltd.
603001
Zhejiang China Commodities Co., Ltd.
600415
Zhejiang Kanglongda Special Protection Technology Co., Ltd.
603665
Zhejiang Red Dragonfly Footwear Co., Ltd.
603116
Zhejiang Zoenn Design Co., Ltd.
300901