 CompanyGraph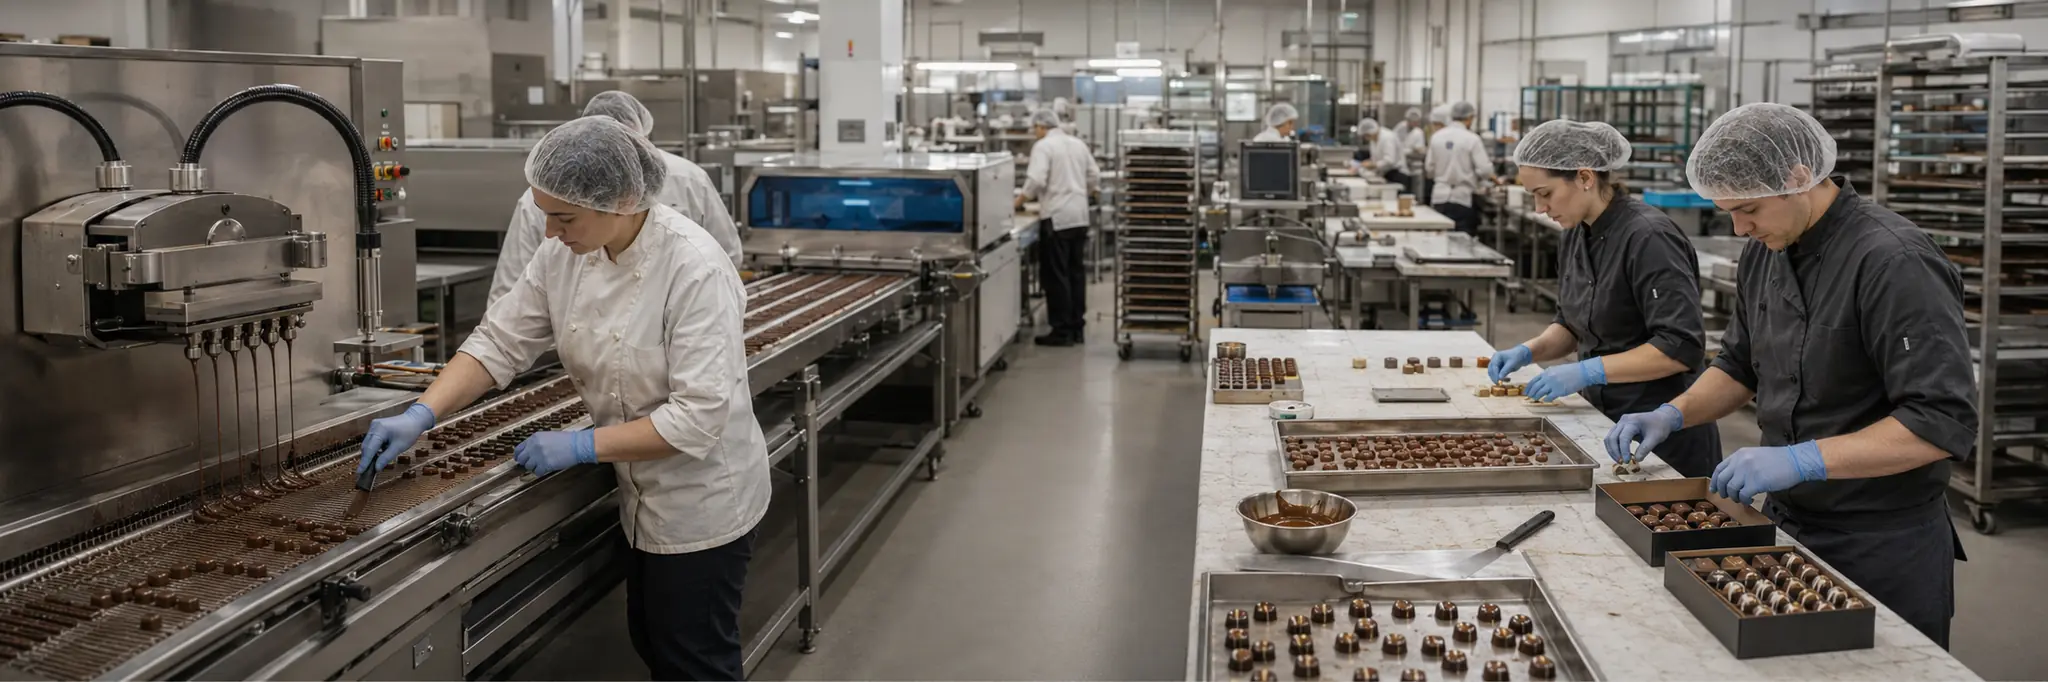
Volatile agricultural commodity costs for cocoa, sugar, and dairy flow through production economics, while brand recognition and retail shelf-space allocation gate consumer access in an impulse-driven category.
Confectionery manufacturing converts agricultural raw materials — cocoa beans, sugar, milk, nuts, and fats — into branded consumer products occupying a distinctive position in food markets: discretionary, emotionally associated, and frequently purchased on impulse or for gifting occasions. The transformation involves multiple processing stages from fermentation and roasting through grinding, conching, tempering, and packaging, each affecting flavor, texture, and shelf stability. Cocoa supply is concentrated in a small number of producing regions, creating procurement exposure to weather, political conditions, and trade policy.
Brand architecture is the primary competitive structure. Consumers develop product-specific preferences, often rooted in long familiarity, that persist across decades. A product's taste profile, texture, and packaging become reference points, creating durable brand loyalty that translates into retail shelf-space allocation. This dynamic favors established brands with long market presence, making share gains by new entrants slow and expensive even when product quality is comparable.
Seasonal concentration is a structural feature of confectionery economics. Holiday periods generate disproportionate shares of annual sales volume, requiring production planning months in advance and inventory build-up timed to retail distribution windows. The combination of perishable inventory, seasonal demand concentration, volatile commodity inputs, and regionally variable consumer preferences creates an operating environment where timing precision in procurement, production scheduling, and distribution is continuously tested.
Structural Role
Coordinates the conversion of volatile agricultural commodities into branded discretionary food products, managing commodity procurement, multi-stage processing, and retail shelf-space competition to deliver products positioned at the intersection of impulse purchase, habitual consumption, and seasonal gifting occasions.
Scale Differentiation
Large confectioners operate global manufacturing and distribution networks with brand portfolios spanning multiple product categories and price points, using advertising scale and retail negotiating power to maintain shelf presence. Mid-size companies hold strong positions in specific national markets or product niches where brand heritage and taste loyalty provide defensible positions. Smaller producers compete through artisanal positioning, local distribution, or specialty ingredients in markets where scale-based cost advantages are less relevant.
Financial Profile
Measured across the 21 companies in this industry with recorded financial statements. Each band spans the middle 90% of companies — 5th to 95th percentile — with the mark at the median. How wide a band runs is itself a reading: a tight band means the industry imposes its economics on every member; a wide one means outcomes differ sharply between its strongest and weakest companies.
Profitability
Gross margin28.9%median
9.5%37.3%
Operating margin9.4%median
0.7%23.4%
Net margin6.4%median
0
-9.4%16.0%
Returns & efficiency
Return on equity9.1%median
0
-159.4%21.1%
Asset turnover0.68×median
0.23×1.04×
Free cash flow / revenue-0.2%median
0
-23.8%24.7%
Balance sheet
Current ratio1.30×median
0.48×3.75×
Debt to equity0.56×median
0.01×30.03×
Reinvestment & payout
R&D / revenue0.3%median
0.0%4.9%
Capex / revenue3.6%median
1.1%40.6%
What marks this industry
Where this industry’s typical company sits against the typical company in every other industry we measure — metric by metric.
R&D / revenue
0.3%typical industry 3.1%
7th lowest of 77 industries with this measure.
Current ratio
1.30×typical industry 1.58×
15th lowest of 102 industries with this measure.
Scale
20
companies with recorded market value
$741M
median company · global median $1.2B
$299M – $39.4B
middle 90% of companies
$136.9B
combined market value
The largest member carries roughly 58% of the combined market value; half the companies sit under $741M.
Valuation ranges
Price to book2.31×median
0.25×8.25×
Price to earnings22.31×median
9.13×59.48×
EV / EBITDA15.70×median
3.37×95.97×
Bands are 5th–95th percentiles across this industry’s companies, computed from reported financial statements. Ratios are currency-free; money values are USD-normalized. These distributions describe how the industry is shaped — they are not a rating of it, and a company’s position inside them is not a forecast. Benchmark set computed 18 September 2026.
Stocks
Bajaj Hindusthan Sugar Ltd.
BAJAJHIND
Balrampur Chini Mills Ltd.
BALRAMCHIN
Baotou Huazi Industry Co. Ltd.
600191
Cloetta AB
CLA.B
Guangxi Rural Investment Group Co., Ltd.
000911
Guangxi Yuegui Guangye Holdings Co., Ltd.
000833
Kanro Inc.
2216
Kaset Thai International Sugar Corporation Public Company Limited
KTIS
Kayseri Seker Fabrikasi A.S.
KAYSE
Lotte Corporation
004990
Mondelez International, Inc.
MDLZ
Morozoff Ltd.
2217
Orion Corporation
271560
Orion Holdings Corp.
001800
Shandong Sanyuan Biotechnology Co., Ltd.
301206
Shree Renuka Sugars Ltd.
RENUKA
The Hershey Company
HSY
Tootsie Roll Industries, Inc.
TR
Top Gum Industries Ltd.
TPGM
Triveni Engineering & Industries Ltd.
TRIVENI
Ülker Bisküvi Sanayi A.Ş.
ULKER