 CompanyGraph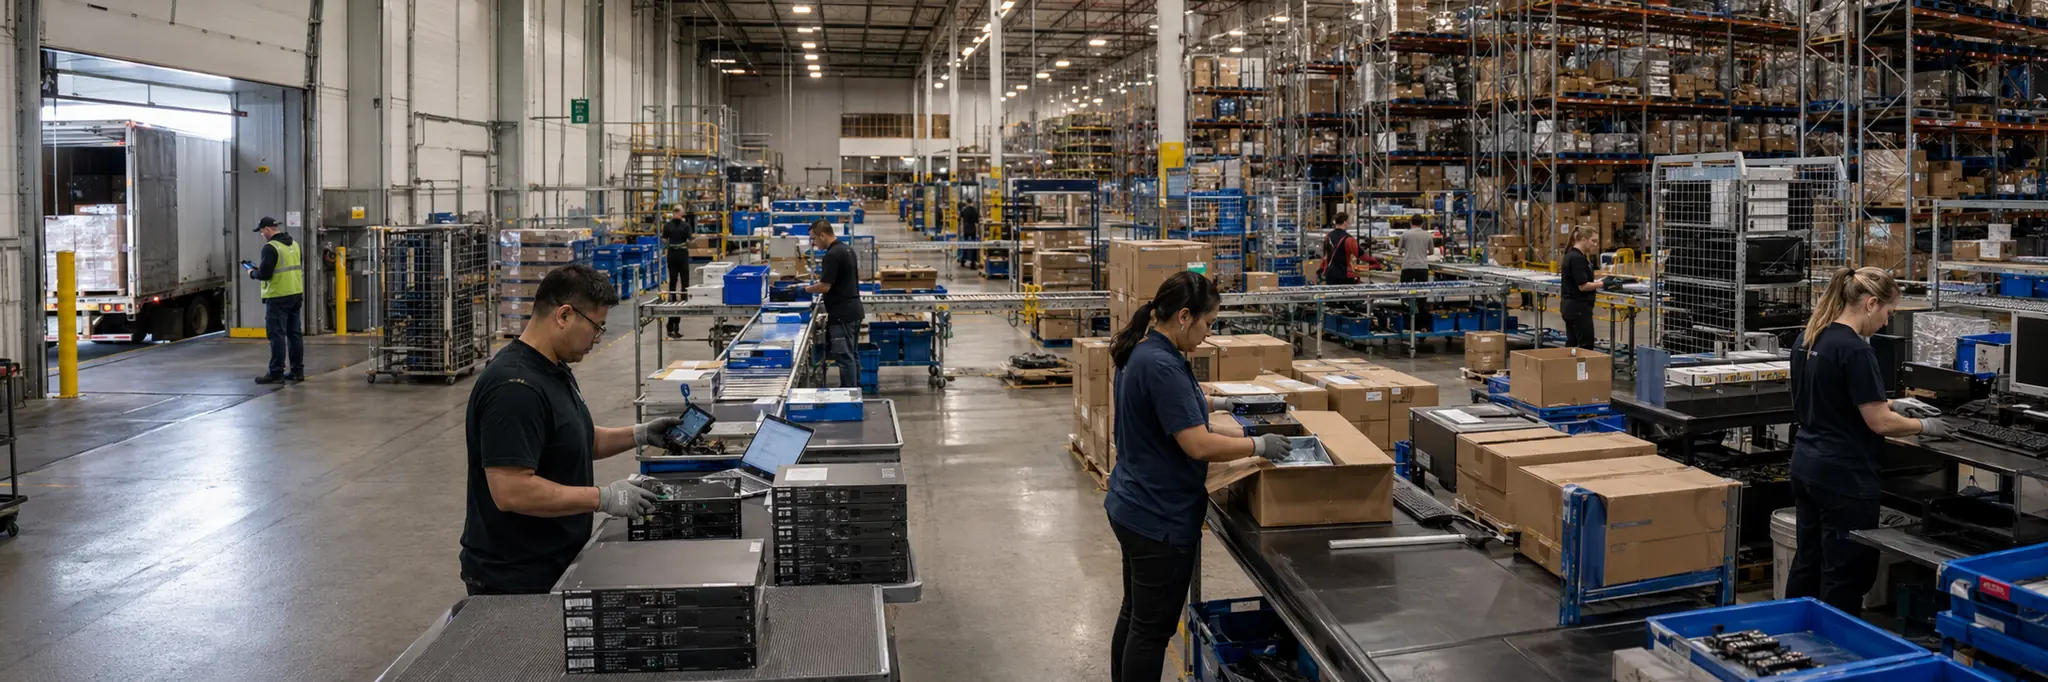
Thin margins and fast-moving technology cycles compress the window between inventory acquisition and obsolescence, making throughput velocity and working capital discipline the binding constraints.
Electronics and computer distributors occupy the middle of the technology supply chain, converting bulk manufacturer shipments into disaggregated, credit-extended deliveries to resellers, system integrators, and enterprise buyers. The core function is logistical and financial intermediation: manufacturers prefer to ship in large quantities to few counterparties, while downstream buyers require smaller quantities, broader product assortments, credit terms, and rapid delivery. The distributor absorbs this structural mismatch.
The margin structure is inherently thin, with profitability dependent on inventory velocity and working capital discipline. Inventory obsolescence is a persistent risk, as technology products lose value when newer generations arrive, and distributors holding excess stock during product transitions face write-downs that can consume months of operating profit. The largest distributors manage this through demand forecasting, real-time inventory visibility, and tighter integration with manufacturer production schedules.
As a midstream intermediary, the distribution function is periodically challenged by manufacturer experiments with direct sales. However, the aggregation, logistics, credit, and value-added services distributors provide remain difficult to replicate when manufacturers sell thousands of SKUs to tens of thousands of buyers across multiple geographies. Value-added services—including configuration, financing, and post-sale support—have become increasingly important as a means of sustaining the intermediary role and deepening relationships with both manufacturers and resellers.
Structural Role
Intermediates between electronics manufacturers and downstream buyers by absorbing inventory risk, consolidating logistics, extending credit, and providing fulfillment services that bridge the mismatch between manufacturer production scale and reseller or enterprise purchasing patterns.
Scale Differentiation
Large distributors operate global warehouse networks, negotiate volume rebates from major manufacturers, and offer value-added services—configuration, kitting, financing, pre-sales engineering—that smaller participants cannot replicate economically. Mid-size distributors focus on specific product categories or geographies where specialized knowledge and service quality create sticky customer relationships. Smaller distributors survive in niches where product expertise, rapid delivery, or technical support for specialized components justifies their intermediary role.
Financial Profile
Measured across the 55 companies in this industry with recorded financial statements. Each band spans the middle 90% of companies — 5th to 95th percentile — with the mark at the median. How wide a band runs is itself a reading: a tight band means the industry imposes its economics on every member; a wide one means outcomes differ sharply between its strongest and weakest companies.
Profitability
Gross margin10.7%median
3.4%29.4%
Operating margin3.5%median
0
-2.6%11.2%
Net margin2.4%median
0
-1.8%11.1%
Returns & efficiency
Return on equity9.6%median
0
-0.1%19.7%
Asset turnover1.46×median
0.40×3.12×
Free cash flow / revenue0.9%median
0
-12.7%11.3%
Balance sheet
Current ratio1.55×median
1.08×3.25×
Debt to equity0.47×median
0.02×1.87×
Reinvestment & payout
R&D / revenue0.7%median
0.1%7.6%
Capex / revenue0.3%median
0.0%9.5%
What marks this industry
Where this industry’s typical company sits against the typical company in every other industry we measure — metric by metric.
Capex / revenue
0.3%typical industry 3.8%
1st lowest of 101 industries with this measure.
Gross margin
10.7%typical industry 29.4%
3rd lowest of 101 industries with this measure.
Asset turnover
1.46×typical industry 0.59×
5th highest of 101 industries with this measure.
Operating margin
3.5%typical industry 8.1%
7th lowest of 101 industries with this measure.
Scale
47
companies with recorded market value
$752M
median company · global median $1.2B
$228M – $11.7B
middle 90% of companies
$123.7B
combined market value
The largest member carries roughly 17% of the combined market value; half the companies sit under $752M.
Valuation ranges
Price to book1.96×median
0.85×11.00×
Price to earnings17.74×median
6.14×62.90×
EV / EBITDA11.91×median
2.95×40.97×
Bands are 5th–95th percentiles across this industry’s companies, computed from reported financial statements. Ratios are currency-free; money values are USD-normalized. These distributions describe how the industry is shaped — they are not a rating of it, and a company’s position inside them is not a forecast. Benchmark set computed 18 September 2026.
Connected Industries
Stocks
Al Hassan Ghazi Ibrahim Shaker Co.
1214
Arrow Electronics Inc.
ARW
Avnet Inc.
AVT
Beijing Oriental Jicheng Co., Ltd.
002819
Beijing Tricolor Technology Co., Ltd.
603516
Climb Global Solutions Inc.
CLMB
Cogobuy Group
0400
Daiwabo Holdings Co., Ltd.
3107
Dicker Data Limited
DDR
Esprinet S.p.A.
PRT
Forcecon Technology Co., Ltd.
3483
Gmi Technology Inc.
3312
Guangdong Rifeng Electric Co., Ltd.
002953
Hold-Key Electric Wire Co. Ltd.
1618
Insight Enterprises Inc.
NSIT
Langfang Development Co. Ltd.
600149
Macnica Holdings Inc.
3132
Metrodata Electronics Tbk
MTDL
Midwich Group plc
MIDW
Mimaki Engineering Co., Ltd.
6638
MobilTel İletişim Hizmetleri A.Ş.
MOBTL
Nanjing Sunlord Electronics Co., Ltd.
300975
Netlist Inc.
NLST
Optiemus Infracom Ltd.
OPTIEMUS
PC Connection, Inc.
CNXN
Rashi Peripherals Ltd.
RPTECH
Rexel SA
RXL
Ryoyo Ryosan Holdings Inc.
167A
Samt Co., Ltd.
031330
ScanSource Inc.
SCSC
Senao International Co., Ltd.
2450
Senshu Electric Co., Ltd.
9824
Shanghai Guangdian Electric Group Co., Ltd.
601616
Shenyu Communication Technology Co., Ltd.
300563
Shenzhen H&T Intelligent Control Co., Ltd.
002402
Shenzhen Huaqiang Industry Co., Ltd.
000062
Sun-Wa Technos Corporation
8137
Synnex Technology International Corp.
2347
Synnex (Thailand) Public Company Limited
SYNEX
TD Synnex Corporation
SNX
Telling Telecommunication Holding Co. Ltd.
000829
Topco Scientific Co., Ltd.
5434
Unisplendour Corporation Limited
000938
Weikeng Industrial Co., Ltd.
3033
WPG Holdings Ltd.
3702
Wuhan P&S Information Technology Co., Ltd.
300184