 CompanyGraph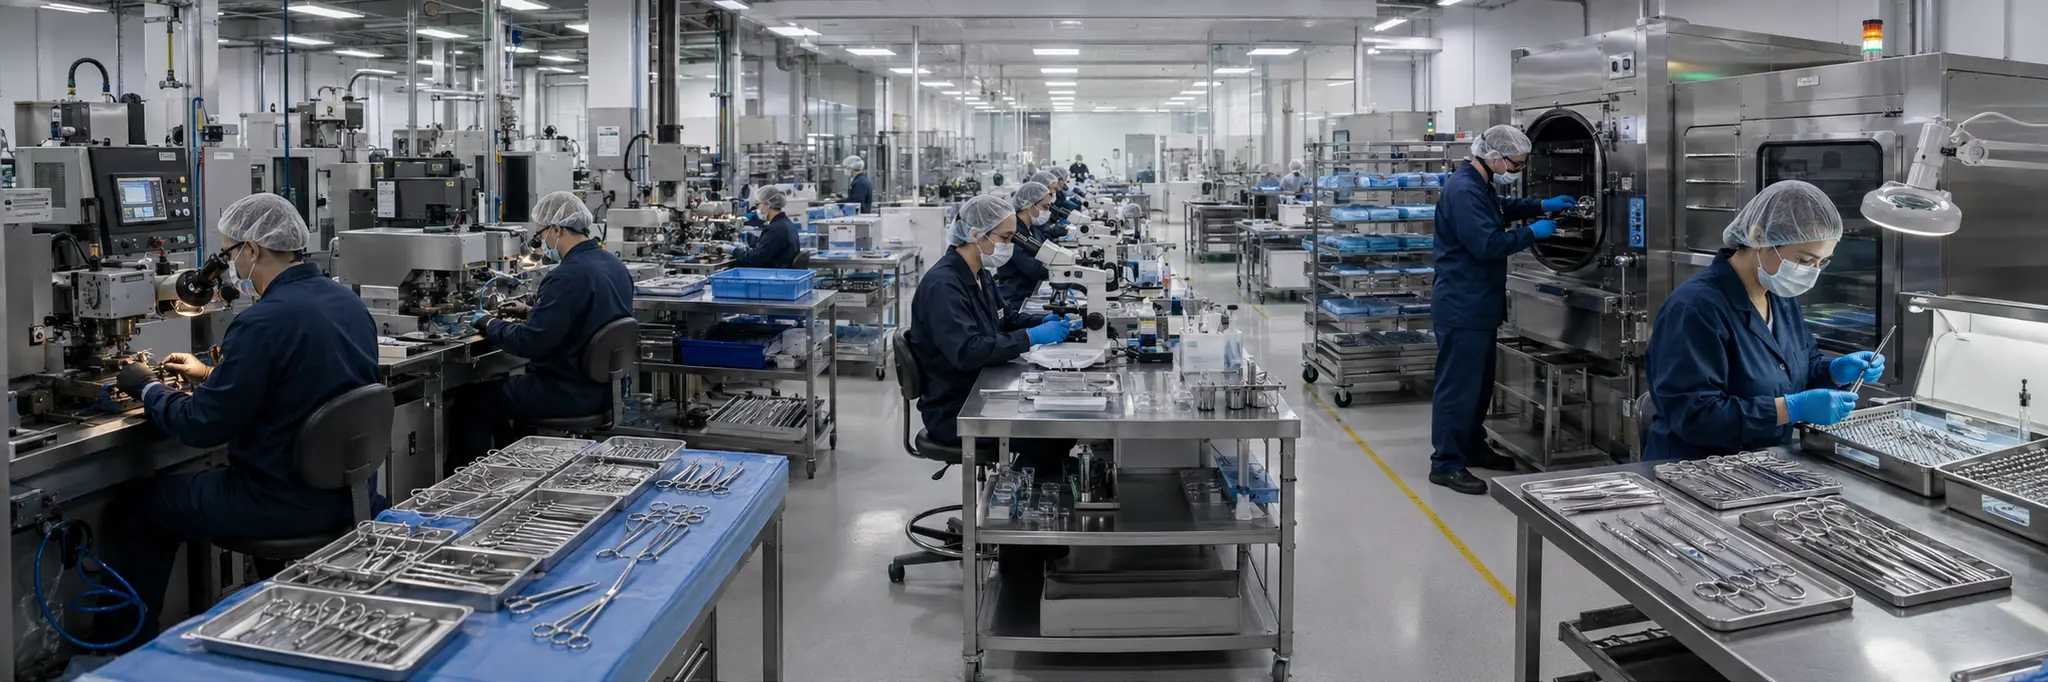
Regulatory approval timelines gate market access for new products, while sterilization, biocompatibility, and manufacturing quality standards create compliance barriers that constrain competitive entry.
The medical instruments and supplies industry converts biocompatible materials through precision manufacturing, sterilization, and regulatory validation into certified tools and consumables used in clinical settings. The distinction between durable instruments and disposable supplies creates two economic models within the same industry: durable instruments involve high development costs and capital-budgeting purchase decisions, while disposable supplies generate recurring revenue tied to procedure volumes and patient census. Many companies participate in both segments, using consumable revenue to stabilize cash flows while investing in higher-margin capital equipment.
The purchasing structure involves a multi-layered decision process. Group purchasing organizations negotiate contracts on behalf of hospital networks, value analysis committees evaluate products against clinical evidence and cost, and individual physicians influence selection based on clinical preference. This fragmented process requires simultaneous engagement with procurement professionals, clinical evaluators, and end-user clinicians, each applying different criteria. Regulatory approval through FDA clearance pathways imposes structural delays between innovation and revenue that define the capital cycle.
As an upstream supplier to healthcare delivery, manufacturing operates under continuous regulatory oversight through Good Manufacturing Practice requirements for documented processes, validated equipment, and traceable materials. Quality failures can result in recalls, warning letters, or facility shutdowns, making manufacturing compliance infrastructure both a significant fixed cost and a barrier to entry that constrains the speed at which any manufacturer can scale production.
Structural Role
Produces the physical tools and consumable materials that enable clinical diagnosis, surgical intervention, and patient care delivery, supplying both durable instruments and disposable products to healthcare facilities.
Scale Differentiation
Large manufacturers maintain broad product portfolios serving multiple clinical departments, creating bundled purchasing relationships and supporting dedicated regulatory affairs teams, global distribution, and clinical sales forces. Mid-size firms focus on specific clinical niches where specialized expertise and physician relationships create defensible positions. Smaller manufacturers face structural disadvantages in regulatory navigation and group purchasing organization access but compete on innovation in emerging product categories.
Financial Profile
Measured across the 109 companies in this industry with recorded financial statements. Each band spans the middle 90% of companies — 5th to 95th percentile — with the mark at the median. How wide a band runs is itself a reading: a tight band means the industry imposes its economics on every member; a wide one means outcomes differ sharply between its strongest and weakest companies.
Profitability
Gross margin52.3%median
22.7%76.1%
Operating margin11.9%median
0
-17.0%32.6%
Net margin8.5%median
0
-30.8%28.2%
Returns & efficiency
Return on equity5.6%median
0
-27.4%22.8%
Asset turnover0.47×median
0.17×0.82×
Free cash flow / revenue4.3%median
0
-51.3%28.9%
Balance sheet
Current ratio2.54×median
0.89×9.68×
Debt to equity0.21×median
0.01×1.26×
Reinvestment & payout
R&D / revenue6.7%median
2.3%23.9%
Capex / revenue6.4%median
0.8%29.7%
What marks this industry
Where this industry’s typical company sits against the typical company in every other industry we measure — metric by metric.
Current ratio
2.54×typical industry 1.58×
11th highest of 102 industries with this measure.
Gross margin
52.3%typical industry 29.4%
12th highest of 101 industries with this measure.
R&D / revenue
6.7%typical industry 3.1%
12th highest of 77 industries with this measure.
Debt to equity
0.21×typical industry 0.37×
16th lowest of 102 industries with this measure.
Scale
108
companies with recorded market value
$1.5B
median company · global median $1.2B
$280M – $30.4B
middle 90% of companies
$720.6B
combined market value
The largest member carries roughly 18% of the combined market value; half the companies sit under $1.5B.
Valuation ranges
Price to book2.78×median
0.96×8.27×
Price to earnings33.04×median
13.07×247.07×
EV / EBITDA bands are not drawn for this industry. Many members run negative values there, and a percentile band across mixed signs has no honest reading — a range is shown only where it means something.
Bands are 5th–95th percentiles across this industry’s companies, computed from reported financial statements. Ratios are currency-free; money values are USD-normalized. These distributions describe how the industry is shaped — they are not a rating of it, and a company’s position inside them is not a forecast. Benchmark set computed 18 September 2026.
Connected Industries
Diagnostics & Research
Regulates
Clinical evidence and FDA validation requirements
Medical Care Facilities
Provides tooling for
Instruments and disposables used in patient care
Medical Distribution
Distributes for
Distributors deliver supplies to healthcare facilities
Metal Fabrication
Supplies inputs to
Precision metal components for instruments
Specialty Chemicals
Supplies inputs to
Biocompatible polymers and sterilization chemicals
Stocks
AddLife AB
ALIF.B
Aidite Qinhuangdao Technology Co., Ltd.
301580
Alcon Inc.
ALC
Align Technology, Inc.
ALGN
Allmed Medical Products Co., Ltd.
002950
Anbio Biotechnology Limited
NNNN
Andon Health Co. Ltd.
002432
Angiodynamics Inc.
ANGO
Ansell Limited
ANN
Anteris Technologies Ltd.
AVR
AptarGroup, Inc.
ATR
AtriCure, Inc.
ATRC
Avantor Inc.
AVTR
Ave Science & Technology Co., Ltd.
688067
Azenta, Inc.
AZTA
Bausch + Lomb Corporation
BLCO
Baxter International Inc.
BAX
Becton, Dickinson and Company
BDX
Beijing Centergate Technologies (Holding) Co. Ltd.
000931
Biodyne Co., Ltd.
314930
Biolife Solutions Inc.
BLFS
BioPlus Co., Ltd.
099430
Blue Sail Medical Co., Ltd.
002382
BMC Medical Co., Ltd.
301367
Caina Technology Co., Ltd.
301122
Cambridge Nutritional Sciences Ltd.
CNSL
Carl Zeiss Meditec AG
AFX
Chimin Health Management Inc.
603222
Chongqing Xishan Science & Technology Co. Ltd.
688576
Coloplast A/S
COLO.B
Coloplast A/S Class B
0QBO
ConvaTec Group Plc
CTEC
Dentsply Sirona Inc.
XRAY
Dr Agarwal's Health Care Ltd
AGARWALEYE
Elekta AB
EKTA.B
Embecta Corp.
EMBC
Envista Holdings Corporation
NVST
EssilorLuxottica
EL
Eyebright Medical Technology Co., Ltd.
688050
Gan & Lee Pharmaceuticals Inc.
603087
Gerresheimer AG
GXI
Guangzhou Jet Biofiltration Co., Ltd.
688026
Guangzhou LBP Medicine Science & Technology Co., Ltd.
688393
Hangzhou Alltest Biotech Co. Ltd.
688606
Harvard Bioscience, Inc.
HBIO
Hubei Huaqiang High-Tech Co., Ltd.
688151
Icu Medical Inc.
ICUI
Imeik Technology Development Co., Ltd.
300896
Improve Medical Instruments Co., Ltd.
300030
Intco Medical Technology Co., Ltd.
300677
Intermestic Inc.
262A
Intuitive Surgical, Inc.
ISRG
Iray Technology Co., Ltd.
688301
Japan Eyewear Holdings Co., Ltd.
5889
Jayamas Medica Industri Tbk
OMED
Jetema Co., Ltd.
216080
Jianerkang Medical Co., Ltd.
603205
Jiangsu Apon Medical Technology Co., Ltd.
300753
Jiangsu Hualan New Pharmaceutical Co., Ltd.
301093
Jiangsu Nanfang Medical Co., Ltd.
603880
Jiangxi Sanxin Medtec Co., Ltd.
300453
Kestra Medical Technologies, Ltd.
KMTS
Kitazato Corporation
368A
Lemaitre Vascular Inc.
LMAT
Lenskart Solutions Limited
LENSKART
Luminex Corp
LMNX
Maider Medical Industry Co., Ltd.
688310
Medeon Biodesign, Inc.
6499
Medline Inc.
MDLN
Merit Medical Systems, Inc.
MMSI
Micro-Tech Nanjing Co., Ltd.
688029
Mingyue Optical Lens Co. Ltd.
301101
Nanosonics Limited
NAN
Ningbo Tianyi Medical Appliance Co. Ltd.
301097
Orasure Technologies Inc.
OSUR
Ovctek China Inc.
300595
Pegavision Corp.
6491
Poly Medicure Ltd.
POLYMED
Pulse Biosciences Inc.
PLSE
Pw Medtech Group Ltd.
1358
Qingdao Novelbeam Technology Co., Ltd.
688677
Qitian Technology Group Ltd.
300061
Repligen Corporation
RGEN
ResMed Inc.
RMD
Riverstone Holdings Ltd.
AP4
Safilo Group S.p.A.
SFL
Sansure Biotech Inc.
688289
Sartorius Stedim Biotech S.A.
DIM
SCHOTT Pharma AG & Co. KGaA
1SXP
Shandong Weigao Group Medical Polymer Co. Ltd.
1066
Shanghai Conant Optical Co., Ltd.
2276
Shanghai International Medical Instruments Co., Ltd.
1501
Shanghai Kindly Enterprise Development Group Co., Ltd.
603987
Shenyang Xingqi Pharmaceutical Co., Ltd.
300573
Solventum Corporation
SOLV
Staar Surgical Company
STAA
Stevanato Group S.p.A.
STVN
Straumann Holding AG
STMN
Suzhou Iron Technology Co., Ltd.
688329
SWS Hemodialysis Care Co., Ltd.
688410
Tauns Laboratories Inc.
197A
Teleflex Incorporated
TFX
The Cooper Companies, Inc.
COO
Tinavi Medical Technologies Co., Ltd.
688277
Tobii Dynavox AB
TDVOX
Tofflon Science and Technology Co., Ltd.
300171
Top Glove Corporation Bhd
7113
Touchstone International Holdings Limited
688013
Tristel Plc
TSTL
Truking Technology Limited
300358
Warby Parker Inc.
WRBY
Well Lead Medical Co., Ltd.
603309
West Pharmaceutical Services, Inc.
WST
Winner Medical Co., Ltd.
300888
Zhejiang Gongdong Medical Technology Co., Ltd.
605369
Zhende Medical Co., Ltd.
603301
Zhonghong Pulin Medical Co., Ltd.
300981