 CompanyGraph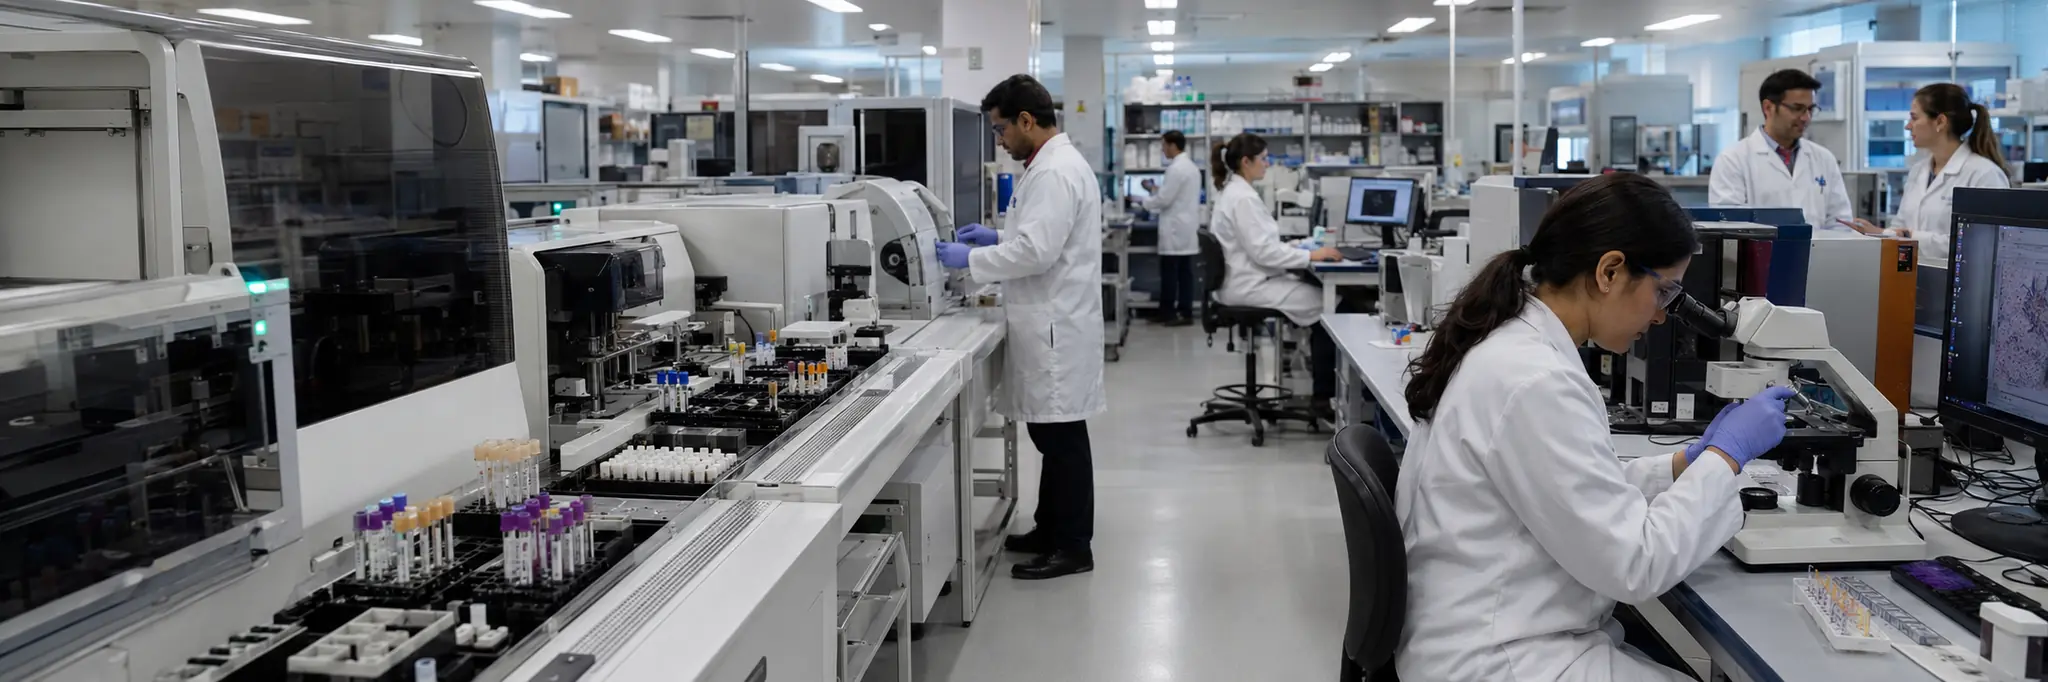
Regulatory approval requirements for clinical products gate market access, while installed instrument bases create proprietary consumable dependencies that lock in recurring reagent revenue.
The diagnostics and research industry converts biological samples into clinically or scientifically actionable results through instruments, reagents, consumables, and software deployed in laboratories and healthcare settings. Clinical diagnostics products perform tests that inform medical decisions—blood chemistry, infectious disease detection, cancer screening, genetic analysis—while life science research products provide tools for scientific investigation in academic, pharmaceutical, and biotechnology laboratories.
The business model frequently follows a razor-and-blade structure where instruments placed in laboratories generate ongoing revenue from proprietary reagents and consumables required for each test. This installed base creates recurring revenue and high switching costs, as changing instrument platforms involves capital investment, staff retraining, and method validation. Regulatory approval requirements for clinical products create additional barriers to entry and extend development timelines.
As an upstream supplier to healthcare delivery and scientific research, the industry's demand is linked to healthcare spending, reimbursement policy, and research funding cycles. Routine high-volume testing generates stable baseline demand, while newer testing modalities in molecular diagnostics, companion diagnostics, and genomics represent areas where technical capability and clinical evidence requirements shape competitive positioning.
Structural Role
Provides the analytical infrastructure—instruments, reagents, and software—that enables disease detection, patient monitoring, and scientific investigation across clinical and research settings, translating biological samples into structured diagnostic or research data.
Scale Differentiation
Large diagnostics companies operate broad portfolios spanning clinical chemistry, immunoassay, molecular diagnostics, and research instruments, leveraging installed base scale for recurring consumable revenue and global regulatory expertise. Mid-size firms focus on specific testing modalities or clinical areas where technical platform depth creates differentiation. Smaller companies compete on emerging technologies, point-of-care applications, or specialized research reagents where established platforms do not yet reach.
Financial Profile
Measured across the 69 companies in this industry with recorded financial statements. Each band spans the middle 90% of companies — 5th to 95th percentile — with the mark at the median. How wide a band runs is itself a reading: a tight band means the industry imposes its economics on every member; a wide one means outcomes differ sharply between its strongest and weakest companies.
Profitability
Gross margin51.6%median
20.7%82.6%
Operating margin9.1%median
0
-41.6%33.4%
Net margin5.3%median
0
-43.7%21.5%
Returns & efficiency
Return on equity3.2%median
0
-21.6%30.7%
Asset turnover0.54×median
0.17×1.14×
Free cash flow / revenue3.6%median
0
-36.6%24.3%
Balance sheet
Current ratio2.47×median
0.85×11.63×
Debt to equity0.27×median
0.01×1.38×
Reinvestment & payout
R&D / revenue11.8%median
2.5%59.9%
Capex / revenue4.6%median
0.9%21.1%
What marks this industry
Where this industry’s typical company sits against the typical company in every other industry we measure — metric by metric.
R&D / revenue
11.8%typical industry 3.1%
6th highest of 77 industries with this measure.
Return on equity
3.2%typical industry 7.1%
8th lowest of 102 industries with this measure.
Current ratio
2.47×typical industry 1.58×
12th highest of 102 industries with this measure.
Gross margin
51.6%typical industry 29.4%
13th highest of 101 industries with this measure.
Scale
66
companies with recorded market value
$2.6B
median company · global median $1.2B
$329M – $48.8B
middle 90% of companies
$1.1T
combined market value
The largest member carries roughly 22% of the combined market value; half the companies sit under $2.6B.
Valuation ranges
Price to book3.30×median
0.92×28.57×
Price to earnings37.50×median
22.05×138.39×
EV / EBITDA bands are not drawn for this industry. Many members run negative values there, and a percentile band across mixed signs has no honest reading — a range is shown only where it means something.
Bands are 5th–95th percentiles across this industry’s companies, computed from reported financial statements. Ratios are currency-free; money values are USD-normalized. These distributions describe how the industry is shaped — they are not a rating of it, and a company’s position inside them is not a forecast. Benchmark set computed 18 September 2026.
Connected Industries
Biotechnology
Provides tooling for
Life science instruments are essential for biotech R&D
Drug Manufacturers General
Provides tooling for
Diagnostic tools and research instruments support drug development
Drug Manufacturers Specialty & Generic
Provides tooling for
Healthcare Plans
Creates demand for
Diagnostic results drive treatment decisions and claims
Health Information Services
Creates demand for
Diagnostic data feeds clinical information systems
Medical Care Facilities
Provides tooling for
Clinical diagnostics deployed in hospitals and labs
Stocks
Abingdon Health plc
ABDX
Adaptive Biotechnologies Corporation
ADPT
Adicon Holdings Ltd
9860
Agilent Technologies Inc.
A
Amoy Diagnostics Co., Ltd.
300685
Beijing Strong Biotechnologies, Inc.
300406
Berry Genomics Co., Ltd.
000710
BGI Genomics Co., Ltd.
300676
BillionToOne, Inc.
BLLN
bioMérieux SA
BIM
CareDx Inc.
CDNA
Castle Biosciences, Inc.
CSTL
CelLBxHealth plc
CLBX
Charles River Laboratories International, Inc.
CRL
Chemclin Diagnostics Co., Ltd.
688468
Cowin Healthcare Co., Ltd.
603122
Danaher Corporation
DHR
Diagnósticos da América S.A.
DASA3
Dian Diagnostics Group Co., Ltd.
300244
Dr. Lal PathLabs Ltd.
LALPATHLAB
Eurofins Scientific SE
ERF
Fleury S.A.
FLRY3
Fulgent Genetics Inc.
FLGT
Gc Cell Corp.
144510
Genedrive Plc
GDR
GeneDx Holdings Corp.
WGS
Grail, Inc.
GRAL
Guangdong Hybribio Biotech Co., Ltd.
300639
Guangzhou Kingmed Diagnostics Group Co. Ltd.
603882
Guardant Health Inc.
GH
Hangzhou Tigermed Consulting Co., Ltd.
300347
ICON plc
ICLR
IDEXX Laboratories, Inc.
IDXX
Illumina, Inc.
ILMN
Integral Diagnostics Ltd
IDX
Integrated Diagnostics Holdings PLC
IDHC
IQVIA Holdings Inc.
IQV
Joinn Laboratories China Co., Ltd.
603127
Krsnaa Diagnostics Ltd.
KRSNAA
Labcorp Holdings Inc.
LH
Lonza Group AG
LONN
Maccura Biotechnology Co., Ltd.
300463
Medicalsystem Biotechnologies Inc.
300439
Medpace Holdings Inc.
MEDP
Metropolis Healthcare Ltd.
METROPOLIS
Mettler-Toledo International Inc.
MTD
Myriad Genetics Inc.
MYGN
NATERA INC (Common Stock) – ticker 45E
NTRA
NeoGenomics Inc.
NEO
Opko Health Inc.
OPK
Personalis Inc.
PSNL
QIAGEN N.V.
QGEN
Quest Diagnostics Inc.
DGX
RadNet Inc.
RDNT
Revvity Inc.
RVTY
Sai Life Sciences Ltd.
SAILIFE
Shanghai Labway Clinical Laboratory Inc.
301060
Shanghai Rendu Biotechnology Co., Ltd.
688193
Shanghai Runda Medical Technology Co., Ltd.
603108
Smo Clinplus Co. Ltd.
301257
Sotera Health Company
SHC
Syngene International Ltd.
SYNGENE
Thalys Medical Technology Inc.
603716
Thermo Fisher Scientific Inc.
TMO
Thyrocare Technologies Ltd.
THYROCARE
Twist Bioscience Corporation
TWST
Veracyte Inc.
VCYT
Vijaya Diagnostic Centre Ltd.
VIJAYA
Waters Corporation
WAT
WuXi AppTec Co., Ltd.
603259