 CompanyGraph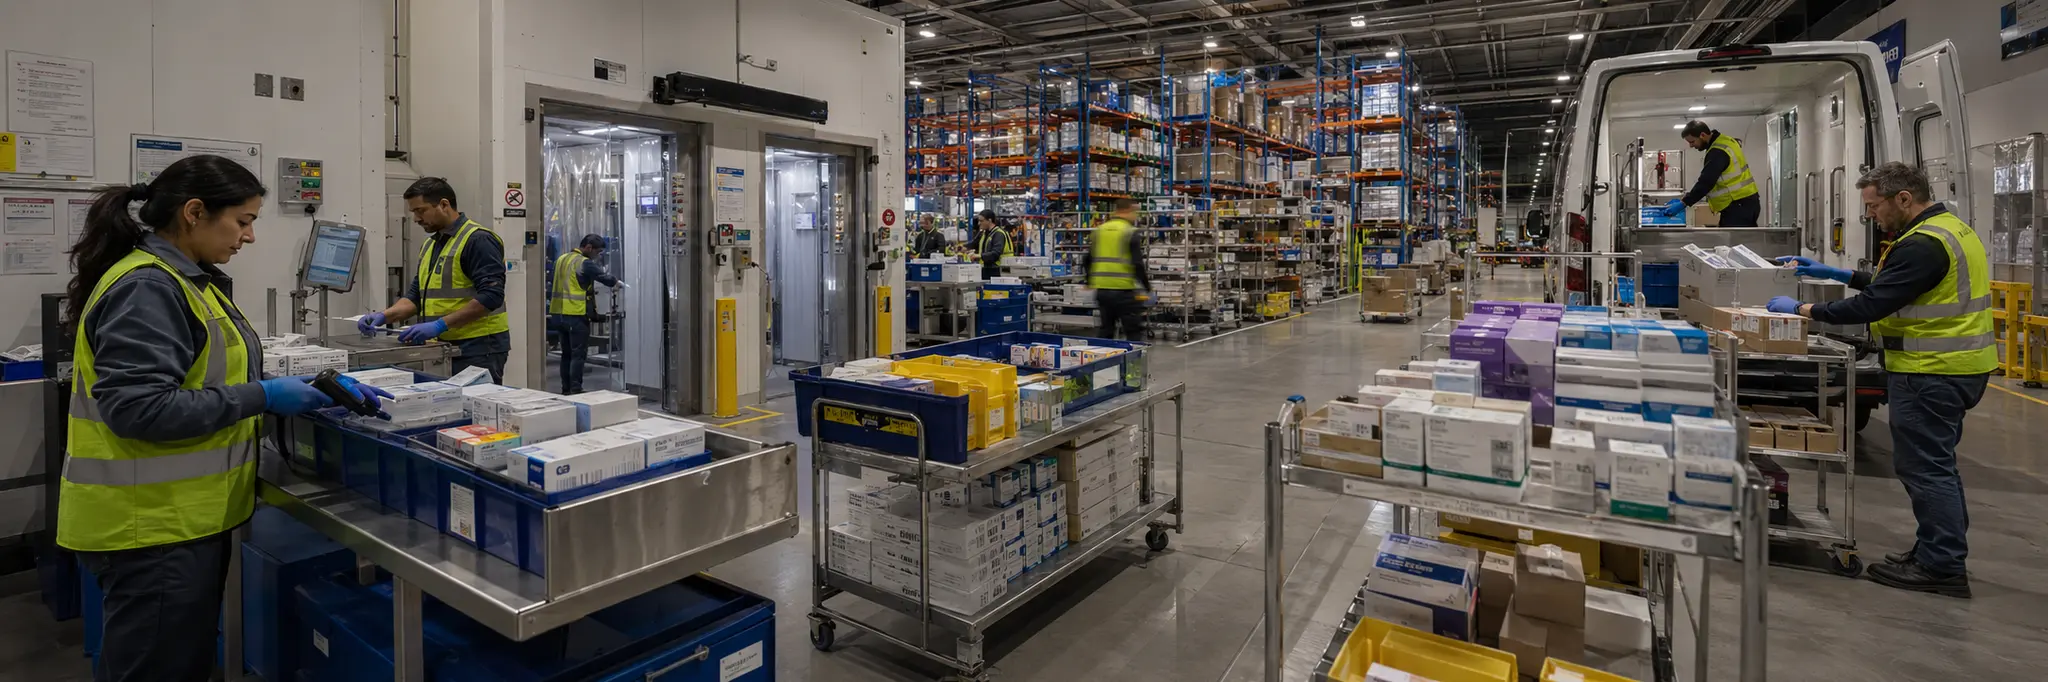
Extremely thin distribution margins measured in low single-digit percentages require massive throughput volume, while regulatory chain-of-custody requirements impose compliance costs across every handling step.
Medical distribution serves as the logistical intermediary that receives products from pharmaceutical manufacturers and medical device companies, consolidates them into climate-controlled warehousing, and delivers them to healthcare providers on schedules ranging from next-day to multiple times daily. The core transformation is inventory consolidation: rather than each healthcare provider maintaining direct purchasing relationships with every manufacturer, the distributor aggregates demand and supply into an efficient intermediary layer spanning thousands of SKUs.
The economics are characterized by high revenue and very thin margins. Distributor compensation comes through buy-side margins, manufacturer fees for service, and prompt-pay discounts, with branded pharmaceutical margins often below two percent of product cost. Profitability depends on volume throughput, working capital efficiency, and ancillary service revenue. Regulatory requirements for product tracing, controlled substance handling, cold chain maintenance, and storage conditions impose substantial operational overhead that scales with product breadth.
As a midstream logistics layer, medical distribution connects upstream manufacturers to downstream healthcare delivery points. The structural divide between high-volume commodity distribution and high-touch specialty logistics for biologics, oncology drugs, and rare disease therapies reflects differing capability requirements: the former demands automation and route optimization, while the latter requires patient support programs, reimbursement assistance, and clinical data management.
Structural Role
Operates the logistics and inventory infrastructure that moves pharmaceutical products, medical devices, and supplies from manufacturers to healthcare delivery points, consolidating thousands of product lines into reliable distribution systems that bridge manufacturing and patient care.
Scale Differentiation
Large distributors operate national warehouse networks with automated picking systems, serving hospital systems and pharmacy chains through high-frequency deliveries, and leveraging volume for manufacturer agreements and technology investment. Mid-size distributors serve regional markets or specialize in specific product categories such as specialty pharmaceuticals. Smaller distributors fill niches in underserved geographies or product segments where delivery frequency and personalized service outweigh national scale cost advantages.
Financial Profile
Measured across the 30 companies in this industry with recorded financial statements. Each band spans the middle 90% of companies — 5th to 95th percentile — with the mark at the median. How wide a band runs is itself a reading: a tight band means the industry imposes its economics on every member; a wide one means outcomes differ sharply between its strongest and weakest companies.
Profitability
Gross margin10.7%median
3.6%40.5%
Operating margin3.4%median
0
-3.0%8.4%
Net margin1.9%median
0
-3.8%8.3%
Returns & efficiency
Return on equity7.6%median
0
-4.3%22.5%
Asset turnover1.22×median
0.38×4.19×
Free cash flow / revenue0.8%median
0
-11.0%9.9%
Balance sheet
Current ratio1.38×median
0.87×1.97×
Debt to equity0.40×median
0.02×1.81×
Reinvestment & payout
R&D / revenue0.4%median
0.0%3.1%
Capex / revenue0.9%median
0.2%3.8%
What marks this industry
Where this industry’s typical company sits against the typical company in every other industry we measure — metric by metric.
Gross margin
10.7%typical industry 29.4%
2nd lowest of 101 industries with this measure.
Operating margin
3.4%typical industry 8.1%
4th lowest of 101 industries with this measure.
Capex / revenue
0.9%typical industry 3.8%
6th lowest of 101 industries with this measure.
Net margin
1.9%typical industry 5.4%
6th lowest of 101 industries with this measure.
Scale
28
companies with recorded market value
$2.1B
median company · global median $1.2B
$419M – $60.1B
middle 90% of companies
$293.8B
combined market value
The largest member carries roughly 35% of the combined market value; half the companies sit under $2.1B.
Valuation ranges
Price to book1.03×median
0.40×5.44×
Price to earnings21.08×median
6.61×68.46×
EV / EBITDA13.05×median
0.04×35.35×
Bands are 5th–95th percentiles across this industry’s companies, computed from reported financial statements. Ratios are currency-free; money values are USD-normalized. These distributions describe how the industry is shaped — they are not a rating of it, and a company’s position inside them is not a forecast. Benchmark set computed 18 September 2026.
Connected Industries
Drug Manufacturers General
Distributes for
Distributes branded pharmaceuticals
Drug Manufacturers Specialty & Generic
Distributes for
Medical Care Facilities
Distributes for
Delivers pharmaceuticals and supplies to hospitals and clinics
Medical Devices
Distributes for
Pharmaceutical Retailers
Distributes for
Supplies retail pharmacies
Trucking
Provides infrastructure for
Temperature-controlled delivery logistics
Stocks
Amplifon SpA
AMP
Arjo AB (publ)
ARJO.B
Cardinal Health Inc.
CAH
Cencora Inc.
COR
China Meheco Co., Ltd.
600056
China National Accord Medicines Corporation Ltd.
200028
China National Accord Medicines Corporation Ltd.
000028
China National Medicines Corporation Ltd.
600511
Entero Healthcare Solutions
ENTERO
Excelsior Medical Co. Ltd.
4104
Guangxi Liyao Group Co. Ltd.
603368
Guangzhou Baiyunshan Pharmaceutical Holdings Co. Ltd.
600332
Guangzhou Baiyunshan Pharmaceutical Holdings Company Limited
0874
Hanmi Science Co., Ltd.
008930
Henry Schein, Inc.
HSIC
Ivd Medical Holding Ltd.
1931
Jointown Pharmaceutical Group Co., Ltd.
600998
Liaoning Chengda Co., Ltd.
600739
McKesson Corporation
MCK
Novolog Ltd.
NVLG
Qingdao Baheal Pharmaceutical Co. Ltd.
301015
Realcan Pharmaceutical Group Co., Ltd.
002589
Selcuk Ecza Deposu Ticaret ve Sanayi A.S.
SELEC
Shanghai C&D Innostic Medical Technology Group Co., Ltd.
301584
Shanghai Pharmaceuticals Holding Co., Ltd.
601607
Shenzhen Glory Medical Co., Ltd.
002551
Sinopharm Group Co., Ltd.
1099
Sipai Health Technology Co., Ltd.
0314
Soho Global Health Pte Ltd
SOHO
Uniphar plc
UPR