 CompanyGraph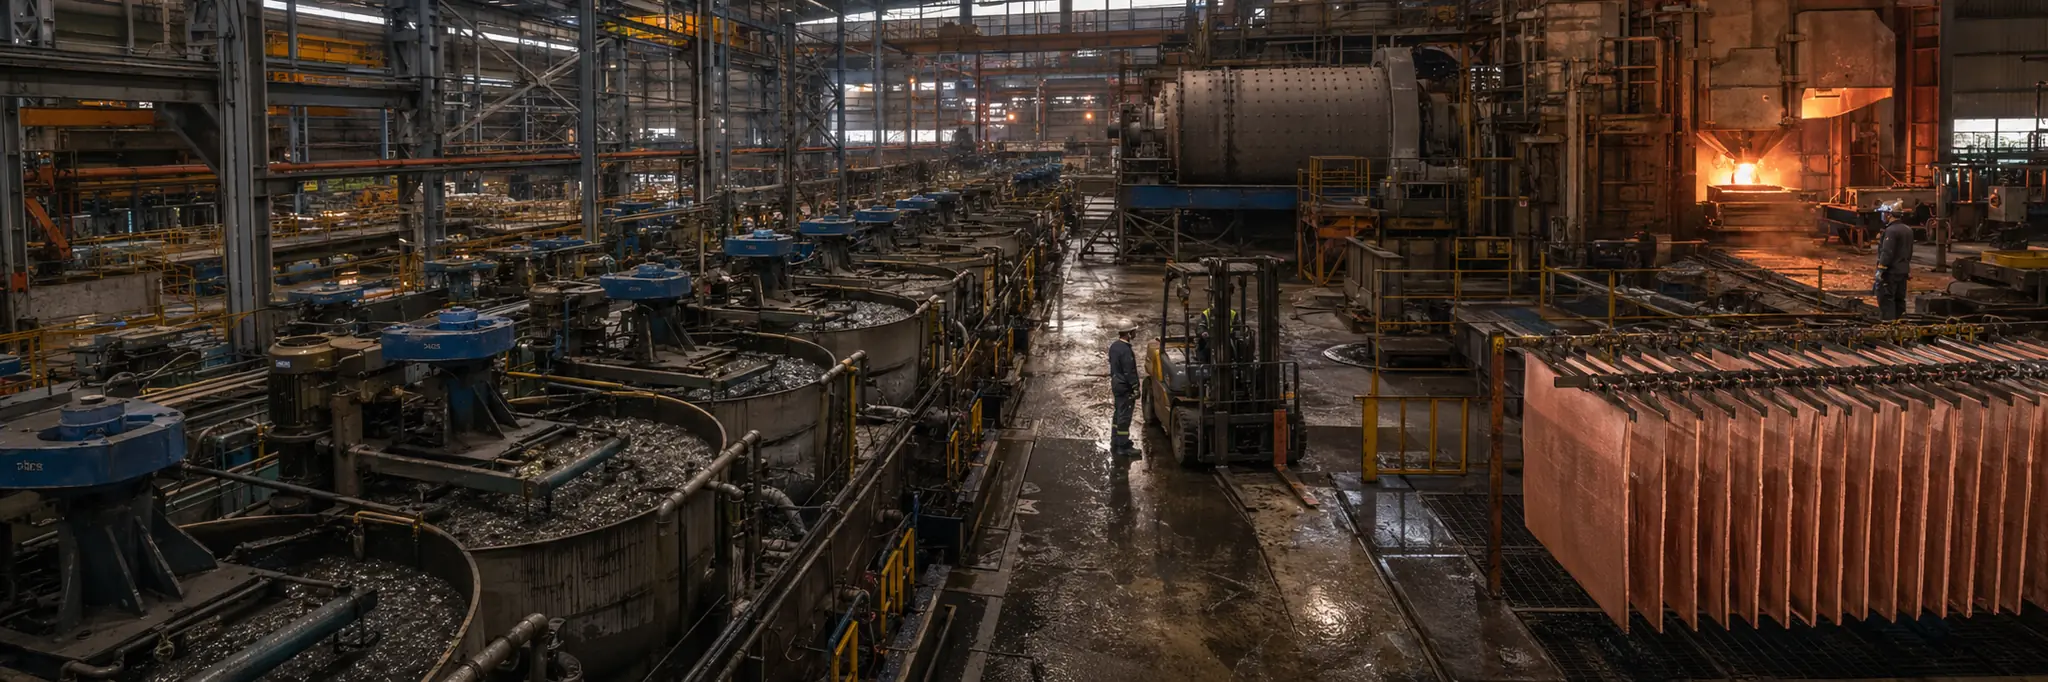
Finite ore deposits and multi-decade project development timelines constrain supply expansion, binding production economics to geological concentration and extraction costs that increase as accessible deposits deplete.
The copper industry transforms finite geological deposits into standardized refined metal used throughout the industrial economy. The process begins with exploration and mine development, followed by extraction, concentration, smelting, and refining into copper cathode suitable for fabrication and electrical applications.
Its structure is defined by geological scarcity, high capital requirements, and long asset lifecycles. Project development spans years of permitting, construction, and infrastructure investment before production begins. Once operational, performance depends on ore grades, energy availability, water access, and stable regulatory conditions.
As an upstream industry, copper producers supply a foundational input to fabrication and manufacturing systems. Demand is therefore tied to broader industrial activity, while supply expansion is constrained by the availability of economically viable deposits and the regulatory environment governing extraction.
Structural Role
Coordinates the discovery, extraction, processing, and delivery of copper metal from finite geological deposits into the industrial value chain, supplying a foundational conductive material required across infrastructure, manufacturing, and energy systems.
Scale Differentiation
Large diversified miners operate multi-asset portfolios across jurisdictions with integrated processing infrastructure and global logistics networks. Mid-sized producers typically focus on fewer assets with regional exposure. Smaller operators may depend on single-mine economics and are more exposed to project-level operational risk and financing constraints.
Financial Profile
Measured across the 38 companies in this industry with recorded financial statements. Each band spans the middle 90% of companies — 5th to 95th percentile — with the mark at the median. How wide a band runs is itself a reading: a tight band means the industry imposes its economics on every member; a wide one means outcomes differ sharply between its strongest and weakest companies.
Profitability
Gross margin18.0%median
1.2%57.1%
Operating margin8.2%median
0
-7.0%39.9%
Net margin2.8%median
0
-22.4%32.9%
Returns & efficiency
Return on equity7.8%median
0
-30.1%28.9%
Asset turnover0.65×median
0.01×3.12×
Free cash flow / revenue-4.5%median
0
-45.0%28.1%
Balance sheet
Current ratio1.56×median
0.98×3.89×
Debt to equity0.53×median
0.02×1.43×
Reinvestment & payout
R&D / revenue0.5%median
0.1%6.2%
Capex / revenue5.8%median
0.8%38.6%
What marks this industry
Where this industry’s typical company sits against the typical company in every other industry we measure — metric by metric.
R&D / revenue
0.5%typical industry 3.1%
12th lowest of 77 industries with this measure.
Free cash flow / revenue
-4.5%typical industry 1.5%
16th lowest of 101 industries with this measure.
Gross margin
18.0%typical industry 29.4%
16th lowest of 101 industries with this measure.
Net margin
2.8%typical industry 5.4%
17th lowest of 101 industries with this measure.
Scale
37
companies with recorded market value
$4.0B
median company · global median $1.2B
$357M – $62.5B
middle 90% of companies
$561.7B
combined market value
The largest member carries roughly 33% of the combined market value; half the companies sit under $4.0B.
Valuation ranges
Price to book2.93×median
1.31×14.76×
Price to earnings32.47×median
13.27×216.80×
EV / EBITDA bands are not drawn for this industry. Many members run negative values there, and a percentile band across mixed signs has no honest reading — a range is shown only where it means something.
Bands are 5th–95th percentiles across this industry’s companies, computed from reported financial statements. Ratios are currency-free; money values are USD-normalized. These distributions describe how the industry is shaped — they are not a rating of it, and a company’s position inside them is not a forecast. Benchmark set computed 18 September 2026.
Connected Industries
Auto Parts
Supplies inputs to
Building Products & Equipment
Supplies inputs to
Copper wiring and plumbing in construction
Electrical Equipment & Parts
Supplies inputs to
Copper is the primary conductive material in electrical equipment
Electronic Components
Supplies inputs to
Residential Construction
Supplies inputs to
Copper wiring and piping in homes
Semiconductors
Supplies inputs to
Copper interconnects in chip packaging
Stocks
Amerigo Resources Ltd.
ARG
Anhui Xinke New Materials Co., Ltd.
600255
Antofagasta plc
ANTO
Arizona Sonoran Copper Company Inc.
ASCUF
Atalaya Mining Copper, S.A.
ATYM
Capstone Copper Corp.
CSCCF
Central Asia Metals plc
CAML
China Daye Non-Ferrous Metals Mining Limited
0661
China Nonferrous Mining Corporation Limited
1258
Ero Copper Corp.
ERO
Faraday Copper Corp.
FDY
First Quantum Minerals Ltd.
FQVLF
Freeport-McMoRan Inc.
FCX
Great Southern Copper PLC
GSCU
GreenX Metals Limited
GRX
Guangdong Jia Yuan Technology Co. Ltd.
688388
Hindustan Copper Ltd.
HINDCOPPER
Hudbay Minerals Inc.
HBM
Ivanhoe Electric Inc.
IE
Jiangxi Copper Co. Ltd.
600362
Jiangxi Copper Company Limited
0358
Jiangxi Jiangnan New Materials Co., Ltd.
603124
Jiangyin Electrical Alloy Co., Ltd.
300697
Jiujiang Defu Technology Co., Ltd.
301511
Lcy Technology Corp.
4989
Lundin Mining Corporation
LUN
MMG Limited
1208
Nanjing Hanrui Cobalt Co., Ltd.
300618
New Frontier Minerals Limited
NFM
New Frontier Minerals Limited
CCZ
Ningbo Boway Alloy Materia Co., Ltd.
601137
Ningbo Jintian Copper Group Co., Ltd.
601609
North Copper Co. Ltd.
000737
Pengxin International Mining Co., Ltd.
600490
Poongsan Holdings Corporation
005810
Sarkuysan Elektrolitik Bakir Sanayi ve Ticaret A.S.
SARKY
Shaanxi Sirui Advanced Materials Co. Ltd.
688102
Southern Copper Corporation
SCCO
Talisman Metals Plc
OVB
Tongling Nonferrous Metals Group Co., Ltd.
000630
Trekor Metals Limited
TKO
Yunnan Copper Co., Ltd.
000878
Zhejiang Hailiang Co., Ltd.
002203