 CompanyGraph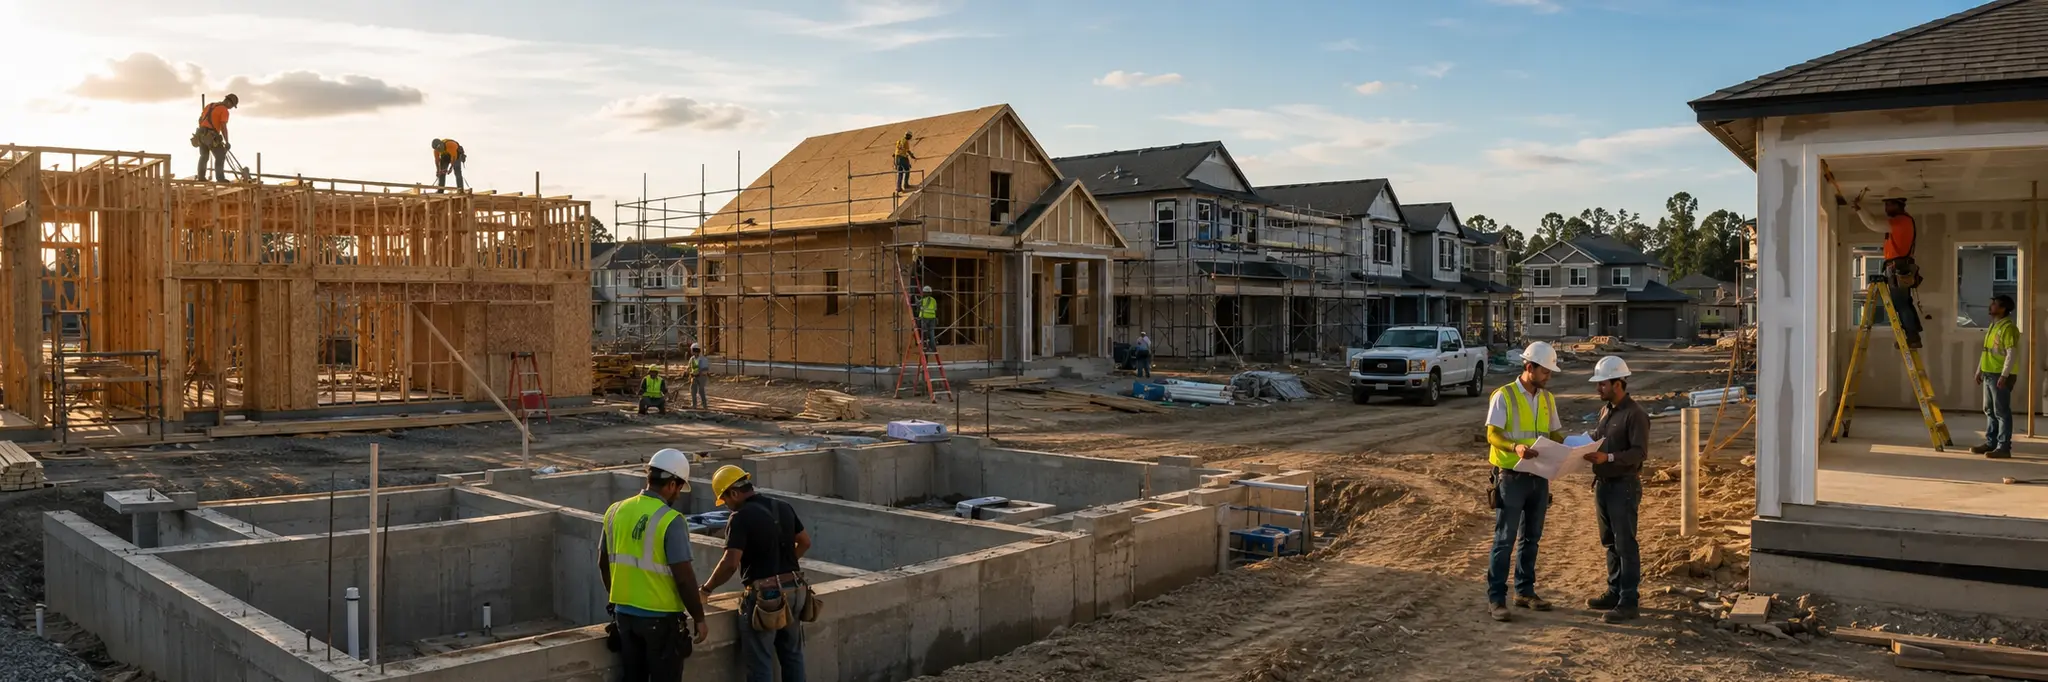
Multi-year land acquisition and entitlement timelines create lead times between capital commitment and revenue, constrained by jurisdiction-specific zoning, permitting, and building code requirements.
Residential construction companies build the housing stock that accommodates population growth, household formation, and replacement of aging structures. The industry encompasses single-family production homebuilding, custom home construction, townhouse and condominium development, and multi-family apartment construction. All segments share the fundamental process of acquiring land, obtaining regulatory entitlements, constructing structures, and delivering finished units to buyers or tenants.
The production cycle introduces significant timing risk. A homebuilder acquires land months or years before homes are sold, commits to construction costs based on current material and labor pricing, and delivers finished homes into a market whose conditions may have changed substantially since the land purchase. This temporal mismatch between cost commitment and revenue realization creates inherent exposure to market shifts. Interest rates function as the primary demand regulator, as mortgage rate changes directly alter buyer purchasing power across entire price segments. Builders respond through incentives, price adjustments, and production pace modifications, but homes already under construction must be completed regardless of demand conditions.
Labor and material availability impose physical constraints on production capacity that financial resources alone cannot overcome. Framing crews, electricians, plumbers, and other trades work across multiple builders, and when aggregate demand exceeds trade capacity, construction timelines extend and labor costs rise for all participants in the same geography. This shared labor pool creates an industry-wide capacity ceiling that binds all builders regardless of individual company size or financial strength. The constraint relaxes during downturns but rebuilding crew capacity after a prolonged slowdown introduces a corresponding lag at the start of recovery cycles.
Structural Role
Converts raw land, construction materials, and skilled labor into habitable residential structures, translating housing demand driven by population growth, household formation, and housing stock replacement into physical supply through a production process governed by land availability, regulatory approvals, and construction capacity.
Scale Differentiation
Large national homebuilders operate across multiple markets, using purchasing scale to negotiate material and land costs while spreading overhead across thousands of closings per year. Mid-size regional builders focus on specific metropolitan areas where local land knowledge, subcontractor relationships, and community reputation provide advantages. Smaller custom and semi-custom builders compete on design flexibility and personalized service in segments where production efficiency matters less than buyer-specific customization.
Financial Profile
Measured across the 29 companies in this industry with recorded financial statements. Each band spans the middle 90% of companies — 5th to 95th percentile — with the mark at the median. How wide a band runs is itself a reading: a tight band means the industry imposes its economics on every member; a wide one means outcomes differ sharply between its strongest and weakest companies.
Profitability
Gross margin22.6%median
10.2%34.8%
Operating margin9.7%median
2.2%23.8%
Net margin7.9%median
0.6%22.5%
Returns & efficiency
Return on equity11.0%median
1.4%19.6%
Asset turnover0.80×median
0.31×1.48×
Free cash flow / revenue3.9%median
0
-7.8%10.7%
Balance sheet
Current ratio4.08×median
1.46×18.29×
Debt to equity0.35×median
0.03×1.69×
Reinvestment & payout
Capex / revenue0.5%median
0.0%4.8%
Dividend payout26.7%median
6.2%368.4%
What marks this industry
Where this industry’s typical company sits against the typical company in every other industry we measure — metric by metric.
Capex / revenue
0.5%typical industry 3.8%
2nd lowest of 101 industries with this measure.
Current ratio
4.08×typical industry 1.58×
3rd highest of 102 industries with this measure.
Return on equity
11.0%typical industry 7.1%
15th highest of 102 industries with this measure.
Scale
31
companies with recorded market value
$1.9B
median company · global median $1.2B
$304M – $22.3B
middle 90% of companies
$183.5B
combined market value
The largest member carries roughly 23% of the combined market value; half the companies sit under $1.9B.
Valuation ranges
Price to book1.05×median
0.40×3.67×
Price to earnings13.61×median
7.13×60.22×
EV / EBITDA11.18×median
7.13×66.85×
Bands are 5th–95th percentiles across this industry’s companies, computed from reported financial statements. Ratios are currency-free; money values are USD-normalized. These distributions describe how the industry is shaped — they are not a rating of it, and a company’s position inside them is not a forecast. Benchmark set computed 18 September 2026.
Connected Industries
Building Materials
Supplies inputs to
Lumber, concrete, roofing consumed in home construction
Building Products & Equipment
Supplies inputs to
Engineering & Construction
Provides tooling for
Site preparation and civil engineering services
Furnishings, Fixtures & Appliances
Creates demand for
New homes create appliance and fixture purchases
Home Improvement Retail
Creates demand for
Lumber & Wood Production
Supplies inputs to
Mortgage Finance
Provides infrastructure for
Buyer financing enables home purchases
Stocks
Azorim Investment Development Ltd.
AZRM
Barratt Redrow plc
BTRW
Beazer Homes USA Inc.
BZH
Bellway plc
BWY
Cairn Homes plc
CRN
Cavco Industries Inc.
CVCO
Crest Nicholson Holdings plc
CRST
Cyrela Brazil Realty S.A. Empreendimentos e Participações
CYRE3
Dream Finders Homes Inc.
DFH
D.R. Horton, Inc.
DHI
Glenveagh Properties PLC
GLV
Green Brick Partners Inc.
GRBK
Hoosiers Holdings Co., Ltd.
3284
Hovnanian Enterprises Inc.
HOV
Installed Building Products Inc.
IBP
KB Home
KBH
Lagenda Properties Bhd
7179
Legacy Housing Corporation
LEGH
Lennar Corporation
LEN
Lennar Corporation
LEN.B
LGI Homes Inc.
LGIH
Meritage Homes Corporation
MTH
Metrovacesa S.A.
MVC
M/I Homes Inc.
MHO
Neinor Homes SA
HOME
PulteGroup Inc.
PHM
Skyline Champion Corporation
SKY
Springfield Properties Plc
SPR
Tama Home Co., Ltd.
1419
Taylor Morrison Home Corporation
TMHC
Toll Brothers Inc
TOL
Vistry Group plc
VTY
Watkin Jones Plc
WJG
Williamsville Sears Management, Inc.
WSML