 CompanyGraph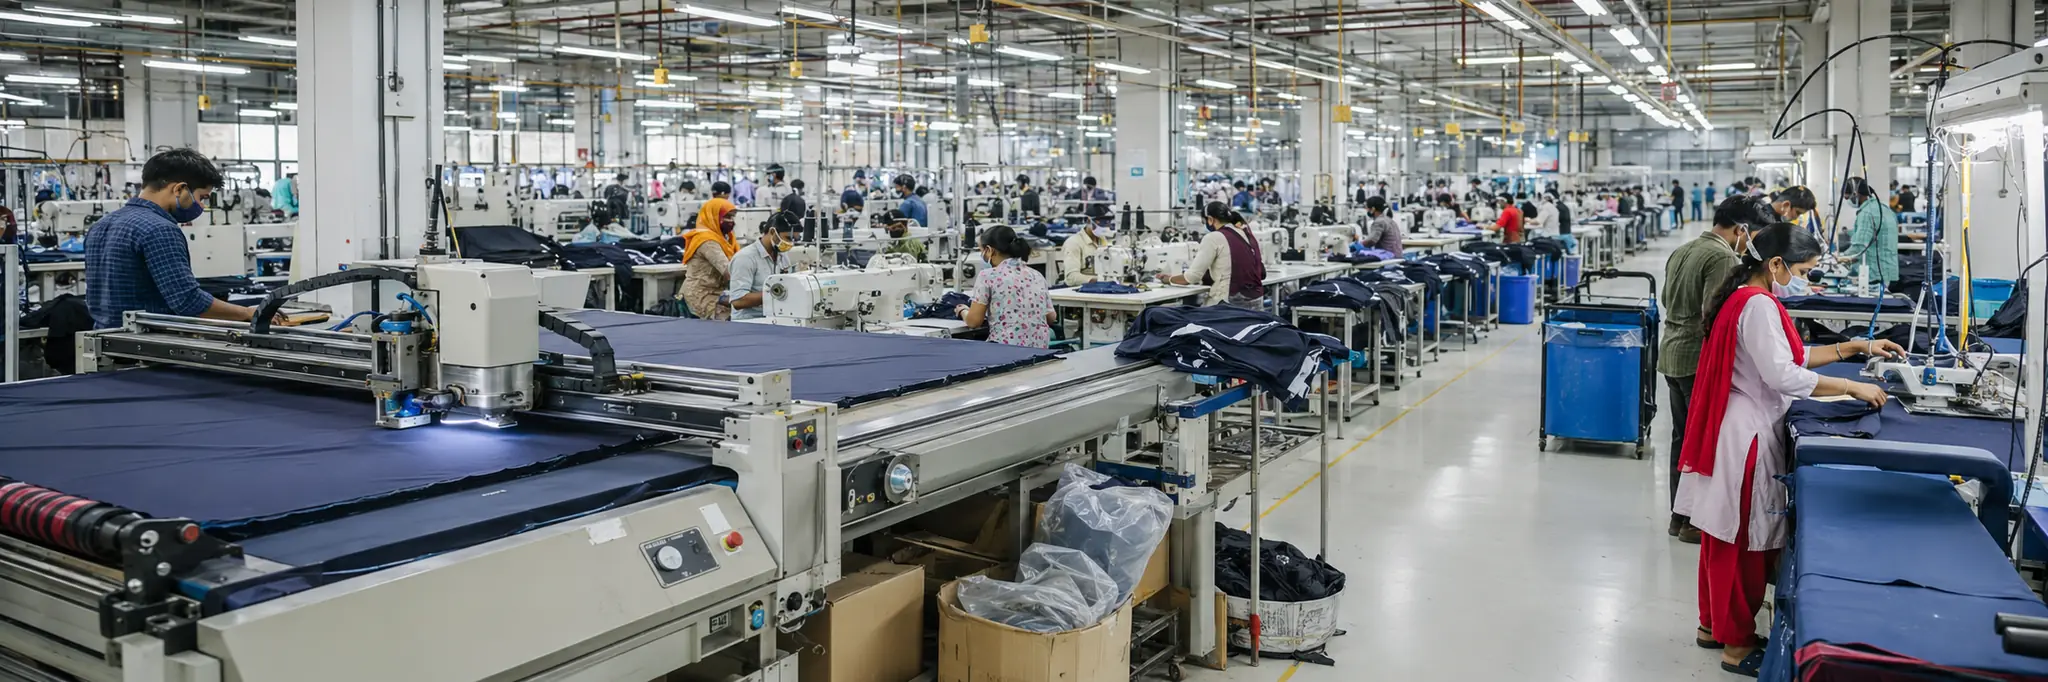
Short fashion cycles and long offshore supply chain lead times create a timing mismatch that concentrates risk in inventory commitment decisions made months before demand materializes.
Apparel manufacturing converts textile materials into finished clothing, footwear, and accessories through a chain spanning design, pattern-making, sourcing, cutting, sewing, finishing, and distribution. The transformation requires coordinating design decisions made months in advance with global supplier networks, contracted production facilities, and logistics systems that deliver finished goods into retail channels within seasonal selling windows.
The industry's structure is defined by short product lifecycles, demand forecasting difficulty, and global supply chain complexity. Fashion cycles compress the period during which products can sell at full price, and unsold inventory loses value rapidly. Lead times between design commitment and retail availability span months, during which consumer preferences may shift. Labor-intensive production processes limit automation, tying output to workforce availability and wage levels in producing countries while exposing manufacturers to labor condition scrutiny and trade policy variability.
Brand strength determines pricing power and margin structure. Branded apparel commands premiums that fund the design, marketing, and distribution infrastructure required to sustain market position, but brand relevance requires continuous renewal. Scale provides advantages in sourcing leverage, marketing efficiency, and distribution reach, while smaller manufacturers compete on design agility, niche specialization, or private-label production where speed and flexibility matter more than volume.
Structural Role
Coordinates the transformation of raw textile materials into finished wearable products, bridging upstream fabric production and downstream retail distribution by managing the design, sourcing, manufacturing, and logistics chain that converts material inputs into consumer-ready apparel.
Scale Differentiation
Large apparel companies operate global sourcing networks, multi-brand portfolios, and owned or controlled distribution channels, spreading design and marketing investment across high unit volumes. Mid-size brands focus on specific market segments where brand identity and product specialization create loyal customer bases. Smaller manufacturers compete on design agility, niche positioning, or private-label production for retailers where speed and flexibility offset scale disadvantages.
Financial Profile
Measured across the 88 companies in this industry with recorded financial statements. Each band spans the middle 90% of companies — 5th to 95th percentile — with the mark at the median. How wide a band runs is itself a reading: a tight band means the industry imposes its economics on every member; a wide one means outcomes differ sharply between its strongest and weakest companies.
Profitability
Gross margin46.5%median
15.4%70.6%
Operating margin8.1%median
0
-13.7%23.7%
Net margin5.5%median
0
-37.5%20.5%
Returns & efficiency
Return on equity7.2%median
0
-29.0%30.2%
Asset turnover0.72×median
0.24×1.39×
Free cash flow / revenue3.8%median
0
-47.0%22.6%
Balance sheet
Current ratio1.91×median
0.85×5.95×
Debt to equity0.24×median
0.02×1.78×
Reinvestment & payout
R&D / revenue2.1%median
0.6%5.7%
Capex / revenue2.9%median
0.3%10.1%
What marks this industry
Where this industry’s typical company sits against the typical company in every other industry we measure — metric by metric.
Gross margin
46.5%typical industry 29.4%
19th highest of 101 industries with this measure.
Scale
86
companies with recorded market value
$719M
median company · global median $1.2B
$240M – $7.4B
middle 90% of companies
$180.4B
combined market value
The largest member carries roughly 17% of the combined market value; half the companies sit under $719M.
Valuation ranges
Price to book1.65×median
0.47×9.33×
Price to earnings20.83×median
6.49×173.35×
EV / EBITDA bands are not drawn for this industry. Many members run negative values there, and a percentile band across mixed signs has no honest reading — a range is shown only where it means something.
Bands are 5th–95th percentiles across this industry’s companies, computed from reported financial statements. Ratios are currency-free; money values are USD-normalized. These distributions describe how the industry is shaped — they are not a rating of it, and a company’s position inside them is not a forecast. Benchmark set computed 18 September 2026.
Connected Industries
Advertising Agencies
Creates demand for
Brand marketing services
Apparel Retail
Supplies inputs to
Supplies finished garments to retail
Department Stores
Supplies inputs to
Internet Retail
Supplies inputs to
Luxury Goods
Supplies inputs to
Premium apparel for luxury channels
Textile Manufacturing
Creates demand for
Consumes fabrics and textiles
Stocks
Aditya Birla Fashion and Retail Ltd.
ABFRL
Aimer Co., Ltd.
603511
Anzheng Fashion Group Co., Ltd.
603839
Baoxiniao Holding Co., Ltd.
002154
Beijing Jiaman Dress Co., Ltd.
301276
Biem.Lfdlkk Garment Co., Ltd.
002832
BRIGHTOIL
0933
Canada Goose Holdings Inc.
GOOS
Cantabil Retail India Ltd.
CANTABIL
Cedar Development Co., Ltd.
002485
China Dongxiang Group Co Ltd.
3818
Columbia Sportswear Company
COLM
Comefly Outdoor Co., Ltd.
603908
Crystal International Group Limited
2232
Dazzle Fashion Co., Ltd.
603587
Eclat Textile Company Ltd.
1476
Ermenegildo Zegna N.V.
ZGN
F&F Co., Ltd.
383220
Figs Inc.
FIGS
Fujian SBS Zipper Science & Technology Co., Ltd.
002098
Fujian Septwolves Industry Co., Ltd.
002029
G-III Apparel Group, Ltd.
GIII
Gildan Activewear Inc.
GIL
Gokaldas Exports Ltd.
GOKEX
Goldwin Inc.
8111
Guangdong Hongxing Industrial Co., Ltd.
001209
Guararapes Confecções S.A.
GUAR3
Guararapes Confecções S.A.
RIAA3
Gunze Limited
3002
Handsome Co. Ltd.
020000
Hansae Co., Ltd.
105630
Hennes & Mauritz AB
HM.B
HLA Group Corp.
600398
Huasi Holding Co., Ltd.
002494
Hubei Mailyard Share Co., Ltd.
600107
Hugo Boss AG
BOSS
Human Made Inc.
456A
Jiangsu Hongdou Industry Co., Ltd.
600400
Jihua Group Corporation Limited
601718
Jinfa Labi Maternity & Baby Products Co., Ltd.
002762
Jinhong Fashion Group Co. Ltd.
603518
Joeone Co., Ltd.
601566
Kitex Garments Ltd.
KITEX
Kontoor Brands Inc.
KTB
Koton Magazacilik Tekstil Anonim Sirketi
KOTON
Lancy Co., Ltd.
002612
Levi Strauss & Co.
LEVI
LF Corp.
093050
Liaoning Shidai Wanheng Co., Ltd.
600241
Lux Industries Ltd.
LUXIND
Makalot Industrial Co., Ltd.
1477
Modern Avenue Group Co., Ltd.
002656
Moncler S.p.A.
MONC
OVS S.p.A.
OVS
Oxford Industries Inc.
OXM
Pearl Global Industries Ltd.
PGIL
PVH Corp.
PVH
Qibu Co., Ltd.
603557
Qingdao Kutesmart Co., Ltd.
300840
Ralph Lauren Corporation
RL
Raymond Lifestyle Ltd.
RAYMONDLSL
Regina Miracle International Holdings Ltd.
2199
Ribo Fashion Group Co., Ltd.
603196
Rumere Co. Ltd.
301088
Sanyo Shokai Ltd.
8011
Shanghai Kai Kai Industrial Co., Ltd.
900943
Shanghai Kai Kai Industrial Co., Ltd.
600272
Shanghai Metersbonwe Fashion & Accessories Co., Ltd.
002269
Shenzhen Ellassay Fashion Co. Ltd.
603808
Shinsegae International Inc.
031430
Sichuan Langsha Holding Co., Ltd.
600137
Sun Tekstil Sanayi ve Ticaret A.Ş.
SUNTK
Tential Inc.
325A
Under Armour Inc.
UAA
Under Armour Inc.
UA
Vakko Tekstil ve Hazir Giyim Sanayi Isletmeleri A.S.
VAKKO
Vedant Fashions Ltd.
MANYAVAR
V.F. Corporation
VFC
Wiselink Co., Ltd.
8932
Xin Hee Co., Ltd.
003016
Yondoshi Holdings Inc.
8008
Youngone Corporation
111770
Youngor Fashion Co., Ltd.
600177
Zhejiang Bangjie Holding Co., Ltd.
002634
Zhejiang Busen Garments Co., Ltd.
002569
Zhejiang Giuseppe Garment Co., Ltd.
002687
Zhejiang Jasan Holding Group Co., Ltd.
603558
Zhejiang Jiaxin Silk Corp.
002404
Zhejiang Semir Garment Co., Ltd.
002563
Zhejiang Weixing Industrial Development Co., Ltd.
002003