 CompanyGraph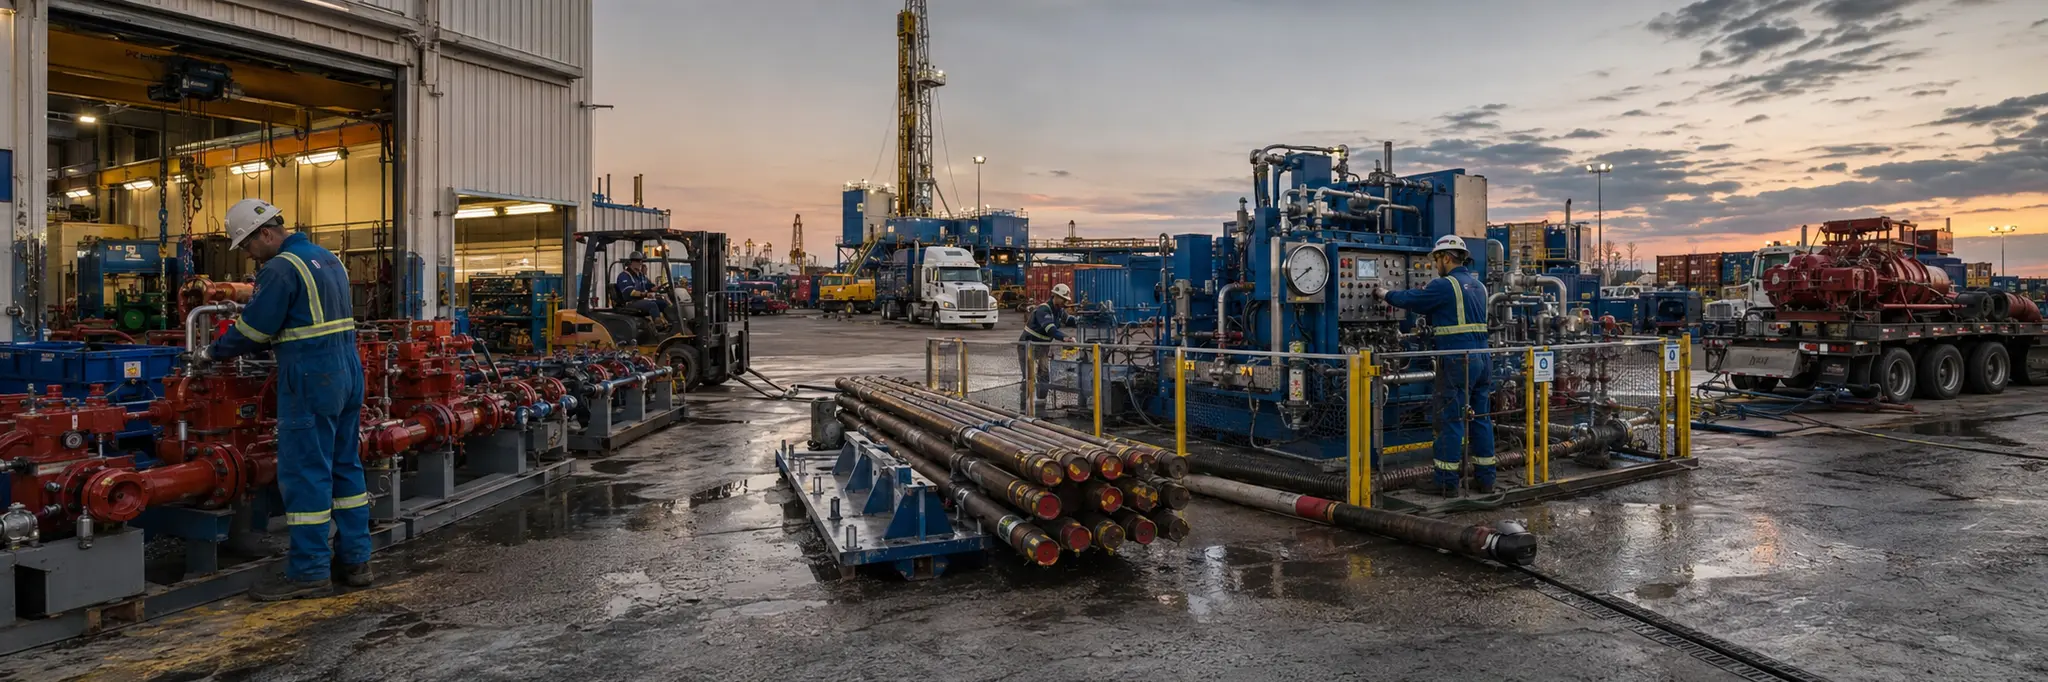
Demand depends directly on upstream exploration spending set by commodity prices, while high capital intensity of specialized equipment creates long asset lifecycles with utilization-dependent returns.
Oil and gas equipment and services companies provide the drilling rigs, pressure pumping fleets, wireline and logging tools, subsea equipment, and technical personnel that exploration and production operators require to locate, access, and produce hydrocarbons. The industry exists because the capital and expertise burden of vertically integrating every aspect of well construction and maintenance was separated into specialized service relationships, creating a distinct supply layer between energy demand and subsurface resource access.
The fundamental feedback loop runs through commodity prices: rising oil and gas prices increase producer spending, which tightens equipment availability and pushes service pricing upward, while falling prices reverse the loop as operators cut budgets, rigs are idled, and pricing collapses. This procyclicality is structural because revenue derives entirely from discretionary upstream capital spending. Asset intensity creates persistent tension between fleet investment and utilization, as multi-year equipment construction timelines mean deliveries often arrive after the cycle has turned.
Technical specialization segments the industry, as deepwater drilling, horizontal well completion, artificial lift systems, and production chemicals each require distinct engineering capabilities. Companies with proprietary technology for specific well conditions can sustain pricing premiums because switching costs and performance risk discourage operator substitution, but this specialization also concentrates revenue exposure to spending decisions within specific operational segments.
Structural Role
Supplies the specialized equipment, technical expertise, and operational services that enable extraction of hydrocarbons from subsurface reservoirs, functioning as the capital goods and services layer between energy demand and raw resource access.
Scale Differentiation
Large service companies maintain global fleets of rigs, pressure pumping equipment, and wireline units, offering integrated service packages across multiple basins and geographies. Mid-size operators specialize in specific service lines or regional markets where local expertise and relationships sustain utilization rates. Smaller firms compete on niche technical capabilities or willingness to operate in markets that larger players find insufficiently scaled.
Financial Profile
Measured across the 93 companies in this industry with recorded financial statements. Each band spans the middle 90% of companies — 5th to 95th percentile — with the mark at the median. How wide a band runs is itself a reading: a tight band means the industry imposes its economics on every member; a wide one means outcomes differ sharply between its strongest and weakest companies.
Profitability
Gross margin23.2%median
8.1%59.7%
Operating margin9.4%median
0
-2.9%38.4%
Net margin6.9%median
0
-11.0%35.5%
Returns & efficiency
Return on equity7.8%median
0
-13.6%30.2%
Asset turnover0.63×median
0.14×1.24×
Free cash flow / revenue6.3%median
0
-38.6%40.5%
Balance sheet
Current ratio1.62×median
0.72×4.77×
Debt to equity0.41×median
0.02×2.11×
Reinvestment & payout
R&D / revenue2.8%median
0.5%7.0%
Capex / revenue4.3%median
0.3%53.5%
What marks this industry
Where this industry’s typical company sits against the typical company in every other industry we measure — metric by metric.
Free cash flow / revenue
6.3%typical industry 1.5%
17th highest of 101 industries with this measure.
Scale
85
companies with recorded market value
$1.5B
median company · global median $1.2B
$305M – $29.5B
middle 90% of companies
$936.4B
combined market value
The largest member carries roughly 53% of the combined market value; half the companies sit under $1.5B.
Valuation ranges
Price to book2.09×median
0.70×12.37×
Price to earnings23.76×median
7.39×300.91×
EV / EBITDA bands are not drawn for this industry. Many members run negative values there, and a percentile band across mixed signs has no honest reading — a range is shown only where it means something.
Bands are 5th–95th percentiles across this industry’s companies, computed from reported financial statements. Ratios are currency-free; money values are USD-normalized. These distributions describe how the industry is shaped — they are not a rating of it, and a company’s position inside them is not a forecast. Benchmark set computed 18 September 2026.
Connected Industries
Oil & Gas Drilling
Provides tooling for
Provides rigs and equipment used by contract drillers
Oil & Gas E&P
Provides tooling for
Supplies drilling rigs, pressure pumping, and completion equipment
Oil & Gas Integrated
Provides tooling for
Oil & Gas Midstream
Provides tooling for
Supplies pipeline and processing equipment
Oil & Gas Refining & Marketing
Provides tooling for
Steel
Creates demand for
Stocks
4146
4146
Aegis Vopak Terminals Ltd.
AEGISVOPAK
Akastor ASA
AKAST
Aker Solutions ASA
AKSO
Anton Oilfield Services Group
3337
Archrock Inc.
AROC
Ashtead Technology Holdings Plc
AT
Atlas Energy Solutions Inc.
AESI
Baker Hughes Company
BKR
Bomesc Offshore Engineering Co., Ltd.
603727
Bristow Group Inc.
VTOL
Cactus Inc.
WHD
Ces Energy Solutions Corp.
CEU
China Oilfield Services Limited
601808
China Oil HBP Science & Technology Co., Ltd.
002554
China Petroleum Engineering Co. Ltd.
600339
CIMC Enric Holdings Ltd.
3899
CNOOC Energy Technology & Services Ltd.
600968
Core Laboratories Inc.
CLB
Dayang Enterprise Holdings Bhd
5141
Dezhou United Petroleum Technology Co., Ltd.
301158
Enerflex Ltd.
EFXT
ENHO
ENHO
Expro Group Holdings N.V.
XPRO
Flotek Industries Inc.
FTK
Flowco Holdings Inc.
FLOC
Forum Energy Technologies Inc.
FET
Fugro N.V.
FUR
Gas Arabian Services Co. Ltd.
9528
Gaztransport et technigaz SA
GTT
Getech Group Plc
GTC
Gulf Marine Services PLC
1196835
Haimo Technologies Group Co., Ltd.
300084
Halliburton Company
HAL
Helix Energy Solutions Group, Inc.
HLX
Houpu Clean Energy Group Ltd.
300471
Innovex International Inc.
INVX
Innovex International, Inc.
DRQ
Jiangsu Hongtian Technology Co., Ltd.
603800
Kodiak Gas Services Inc.
KGS
LandBridge Company LLC
LB
Lanpec Technologies Ltd.
601798
Liberty Energy Inc.
LBRT
Modec Inc.
6269
Moreld ASA
MORLD
Multikarya Asia Pasifik Raya
MKAP
Nanjing Develop Advanced Manufacturing Co., Ltd.
688377
National Energy Services Reunited Corp.
NESR
Natural Gas Services Group, Inc.
NGS
New JCM Group Co., Ltd.
300157
NextDecade Corporation
NEXT
North American Construction Group Ltd.
NOA
Nov Inc.
NOV
NPK International Inc.
NR
Oceaneering International, Inc.
OII
Offshore Oil Engineering Co. Ltd.
600583
Oil States International Inc.
OIS
Pason Systems Inc.
PSI
Plexus Holdings plc
POS
ProFrac Holding Corp.
ACDC
ProPetro Holding Corp.
PUMP
Ranger Energy Services Inc.
RNGR
Reach Subsea ASA
REACH
Rpc Inc.
RES
Saipem S.p.A.
SPM
SBM Offshore N.V.
SBMO
Schlumberger Limited
SLB
Sea1 Offshore Inc.
SEA1
Select Water Solutions Inc.
WTTR
Shandong Molong Petroleum Machinery Company Limited
002490
Shuifa Energas Gas Co., Ltd.
603318
Sino Geophysical Co., Ltd.
300191
Sinopec Oilfield Equipment Corporation
000852
Solaris Energy Infrastructure Inc.
SEI
Solaris Energy Infrastructure, Inc.
SOI
Subsea 7 S.A.
0OGK
TechnipFMC plc
FTI
Tenaris S.A.
0HXB
Terravest Industries Inc.
TVK
Texas Gulf Energy Inc.
TXGE
TGS-NOPEC Geophysical Company
TGSO
Tidewater Inc.
TDW
Tong Petrotech Corp.
300164
Total Energy Services Inc.
TOT
WaterBridge Infrastructure LLC
WBI
Weatherford International plc
WFRD
Xinjiang Zhundong Petroleum Technology Co., Ltd.
002207
Yantai Jereh Oilfield Services Group Co., Ltd.
002353
Yinson Holdings Berhad
7293
Zhejiang Renzhi Co., Ltd.
002629