 CompanyGraph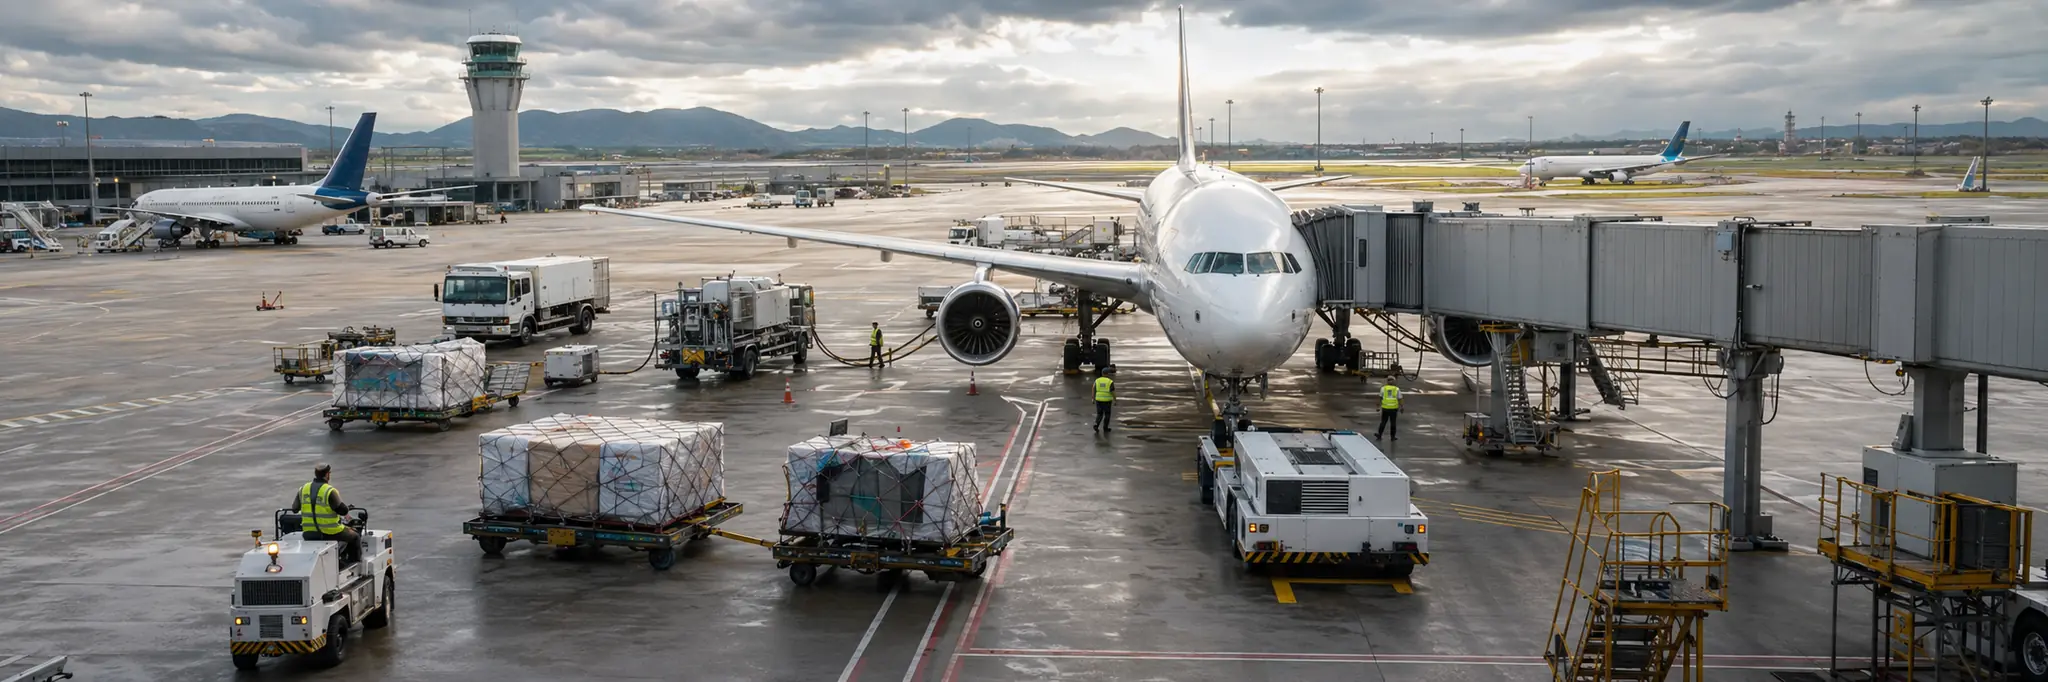
Geographically fixed infrastructure with natural monopoly characteristics captures aeronautical and commercial fees from captive airline and passenger traffic, constrained by regulatory pricing oversight.
Airports convert fixed infrastructure — runways, terminals, taxiways, and gate systems — into aviation access, collecting aeronautical fees from airlines for the physical capacity to operate scheduled services and non-aeronautical revenue from passengers who pass through terminal environments. Ground handling and catering companies provide the labor-intensive operational services that airlines require at each station, converting specialized equipment and workforce availability into aircraft turnaround capability.
The industry's structure is defined by geographic fixity, regulatory constraint, and dual revenue exposure. An airport's catchment area determines its traffic potential, and that potential cannot be relocated or replicated without extraordinary capital and political commitment. Aeronautical fee structures are typically regulated or negotiated with airline groups, limiting pricing discretion on the core infrastructure service. Non-aeronautical revenue from retail, duty-free, food, and parking depends on passenger volumes and dwell time, creating a commercial layer whose performance is coupled to but distinct from the underlying aviation traffic. Runway and terminal capacity is physically finite, and expansion faces land availability, noise regulation, and environmental constraints that impose hard throughput ceilings.
Scale differentiates operators through traffic mix and commercial yield. Large hub airports serving international long-haul traffic generate higher per-passenger commercial revenue through duty-free and premium retail spending. Regional airports depend on narrower carrier and route mixes, making them sensitive to individual airline scheduling decisions. Ground handling and catering companies compete across multi-airport networks where contract scale and equipment utilization determine margins, operating in a structurally competitive environment where airlines retain the ability to insource or switch providers.
Structural Role
Provides the fixed physical node through which air transportation is accessed, connecting airlines to passengers and cargo through runway systems, terminals, and ground-side service operations that cannot be bypassed or replicated without extraordinary capital and regulatory commitment.
Scale Differentiation
Large airport operators manage portfolios of hub and gateway airports where international long-haul traffic generates high per-passenger commercial revenue through duty-free, luxury retail, and lounge services. Mid-size airports depend on a narrower mix of carriers and routes, making them more sensitive to individual airline decisions on capacity deployment. Ground handling and catering companies compete on operational reliability and cost efficiency across multi-airport networks, where contract scale and equipment utilization determine margins. Single-airport operators are structurally tied to the traffic dynamics of their catchment area with limited diversification options.
Financial Profile
Measured across the 22 companies in this industry with recorded financial statements. Each band spans the middle 90% of companies — 5th to 95th percentile — with the mark at the median. How wide a band runs is itself a reading: a tight band means the industry imposes its economics on every member; a wide one means outcomes differ sharply between its strongest and weakest companies.
Profitability
Gross margin29.9%median
20.0%74.2%
Operating margin17.6%median
0
-80.3%46.3%
Net margin12.9%median
0
-100.0%29.7%
Returns & efficiency
Return on equity6.3%median
0
-20.4%24.8%
Asset turnover0.34×median
0.15×0.72×
Free cash flow / revenue4.1%median
0
-332.1%27.7%
Balance sheet
Current ratio1.84×median
0.25×6.99×
Debt to equity0.62×median
0.03×1.38×
Reinvestment & payout
Capex / revenue9.6%median
1.5%66.1%
What marks this industry
Where this industry’s typical company sits against the typical company in every other industry we measure — metric by metric.
Capex / revenue
9.6%typical industry 3.8%
9th highest of 101 industries with this measure.
Operating margin
17.6%typical industry 8.1%
12th highest of 101 industries with this measure.
Net margin
12.9%typical industry 5.4%
13th highest of 101 industries with this measure.
Asset turnover
0.34×typical industry 0.59×
16th lowest of 101 industries with this measure.
Scale
21
companies with recorded market value
$2.8B
median company · global median $1.2B
$486M – $12.5B
middle 90% of companies
$129.3B
combined market value
The largest member carries roughly 36% of the combined market value; half the companies sit under $2.8B.
Valuation ranges
Price to book2.08×median
0.59×4.83×
Price to earnings17.82×median
13.02×89.45×
EV / EBITDA bands are not drawn for this industry. Many members run negative values there, and a percentile band across mixed signs has no honest reading — a range is shown only where it means something.
Bands are 5th–95th percentiles across this industry’s companies, computed from reported financial statements. Ratios are currency-free; money values are USD-normalized. These distributions describe how the industry is shaped — they are not a rating of it, and a company’s position inside them is not a forecast. Benchmark set computed 18 September 2026.
Connected Industries
Aerospace & Defense
Creates demand for
Airport expansion drives demand for specialized construction and systems
Airlines
Provides infrastructure for
Airports provide the physical infrastructure airlines require for operations
Engineering & Construction
Creates demand for
Terminal and runway construction and renovation
Lodging
Creates demand for
Airport proximity drives hotel demand for transit passengers
Oil & Gas Refining & Marketing
Creates demand for
Aviation fuel storage and distribution at airport facilities
Restaurants
Supplies inputs to
Food service operators supply airport terminal dining concessions
Security & Protection Services
Creates demand for
Airport security screening and perimeter protection
Specialty Retail
Supplies inputs to
Retail operators run duty-free and terminal shops under concession
Travel Services
Provides infrastructure for
Airports are physical nodes in the travel distribution chain
Stocks
Aena SME SA
AENA
AerSale Corporation
ASLE
Athens International Airport S.A.
AIA
Beijing Capital International Airport Company Limited
0694
Blade Air Mobility Inc.
BLDE
Catrion Catering Holding Co.
6004
Çelebi Hava Servisi A.Ş.
CLEBI
Citic Offshore Helicopter Co., Ltd.
000099
Corp America Airports S.A.
CAAP
GMR Airports Limited
GMRAIRPORT
GMR Airports Limited
GMRINFRA
Grupo Aeroportuario del Centro Norte S.A.B. de C.V.
OMAB
Grupo Aeroportuario del Pacífico S.A.B. de C.V.
GAPB
Grupo Aeroportuario del Sureste, S.A.B. de C.V.
ASURB
Guangzhou Baiyun International Airport Co., Ltd.
600004
Hainan Meilan International Airport Company Limited
0357
Japan Airport Terminal Co. Ltd.
9706
Joby Aviation, Inc.
JOBY
Shanghai International Airport Co., Ltd.
600009
Shenzhen Airport Co., Ltd.
000089
TAV Havalimanlari Holding A.S.
TAVHL
Wheels Up Experience Inc.
UP
Xiamen International Airport Co., Ltd.
600897